Library › Imaging › Echocardiography normal values
Transthoracic echocardiography: standard views, chamber quantification, and normal values
Standard adult transthoracic views, measurement technique, and sex-specific normal values and severity partitions for every cardiac chamber, from the ASE/EACVI and ASE guidelines.
Chamber quantification in adults follows the 2015 American Society of Echocardiography (ASE) and European Association of Cardiovascular Imaging (EACVI) recommendations for the left heart and the 2025 ASE right heart guideline for the right heart. Biplane ejection fraction is normal from 52% in men and 54% in women; left atrial volume index is enlarged above 34 mL/m²; left ventricular mass index by the linear method is increased above 115 g/m² in men and 95 g/m² in women; tricuspid annular plane systolic excursion (TAPSE) is reduced at 1.7 cm or less; and global longitudinal strain (GLS) more negative than −18% is normal.
Standard transthoracic views and patient positioning
A comprehensive transthoracic echocardiogram combines two-dimensional imaging, color Doppler, spectral Doppler, and, when indicated, three-dimensional imaging, strain, and contrast, acquired in a fixed sequence of windows. The 2019 ASE guideline for the comprehensive examination defines that sequence and the measurements expected from each view. Every chamber, valve, the proximal great arteries, the pericardium, and the systemic veins are examined from more than one direction. A study confined to a parasternal long-axis and an apical four-chamber view, without Doppler or assessment of the right heart and aorta, is incomplete.
Patient positioning. Parasternal and apical imaging is performed in the left lateral decubitus position, which brings the heart against the chest wall and moves lung out of the acoustic path. For apical views, the left arm is raised and the patient rotated further toward the left; a mattress with an apical cutout lets the transducer reach the true apex from below. The subcostal window is imaged supine with the knees flexed to relax the abdominal wall, the suprasternal window supine with the neck extended, and the right parasternal window in the right lateral decubitus position. Height, weight, blood pressure, heart rate, and rhythm are recorded at the time of the study. Indexing depends on body size, and gradients, dimensions, and regurgitant jets change with loading and cycle length. An electrocardiographic lead with a distinct R wave identifies end-diastolic frames and triggers cine loops.
Display convention. In the ASE convention, the base of the heart lies on the right of the screen in the parasternal long-axis view; in apical views the apex is at the top of the sector and the left-sided chambers appear on the right; short-axis views are displayed as if seen from the apex. Some laboratories display apical views with the apex at the bottom, a convention that changes the appearance but not the anatomy.
| Window and view | Structures shown | Principal measurements |
|---|---|---|
| Parasternal long axis | Right ventricular outflow, septum, LV, mitral valve, LVOT, aortic valve, aortic root, LA; descending aorta and coronary sinus posteriorly | LVIDd, LVIDs, IVSd, PWTd; LVOT diameter; aortic annulus, sinuses, sinotubular junction, proximal ascending aorta; RVOT proximal diameter |
| Parasternal RV inflow and RV outflow | RA, tricuspid valve, RV inflow, inferior vena cava entry; RVOT, pulmonic valve, main pulmonary artery | Tricuspid regurgitant velocity; RVOT velocity-time integral and acceleration time; pulmonary artery diameter |
| Parasternal short axis (aortic, mitral, papillary, apical levels) | Aortic cusps with right-heart structures around them; mitral orifice; LV with both papillary muscles; apical LV | RVOT distal diameter; LV eccentricity index; regional wall motion of all segments at each level; 2D LV mass (papillary level) |
| Apical four-chamber | All four chambers, both atrioventricular valves, inferoseptal and anterolateral walls | Biplane LV and LA volumes (with two-chamber); mitral inflow and annular velocities; MAPSE; GLS |
| Apical RV-focused | RV at maximal basal width with the LV apex centered; lateral tricuspid annulus | RV basal, mid, and longitudinal diameters; RV areas and FAC; TAPSE; RV s′; RV strain; RA area and volume |
| Apical five-chamber | Four chambers with LVOT and aortic valve | LVOT pulsed-wave velocity-time integral; aortic continuous-wave Doppler |
| Apical two-chamber | LV and LA only; anterior and inferior walls; LA appendage | Biplane LV and LA volumes; GLS |
| Apical three-chamber (long axis) | LA, mitral valve, LV, LVOT, aortic valve; anteroseptal and inferolateral walls | GLS; alternative LVOT and aortic Doppler alignment |
| Subcostal four-chamber and short axis | Liver in the near field; RV free wall; atrial septum perpendicular to the beam; pericardium | RV wall thickness; atrial septal integrity; effusion along the RV free wall |
| Subcostal inferior vena cava | Inferior vena cava entering the RA with hepatic veins joining it | IVC diameter and inspiratory collapse; hepatic vein flow |
| Suprasternal long and short axis | Ascending aorta, arch with three branches, descending aorta; right pulmonary artery beneath; LA with pulmonary veins | Arch and proximal descending aortic diameters; descending aortic flow reversal; aortic continuous-wave Doppler |
| Right parasternal | Ascending aorta and aortic valve | Aortic continuous-wave Doppler aligned with an anteriorly directed jet |
Standard adult transthoracic views and the measurements taken in each, after the 2019 ASE comprehensive examination guideline and the 2015 ASE/EACVI chamber quantification recommendations. FAC, fractional area change; GLS, global longitudinal strain; IVC, inferior vena cava; IVSd, interventricular septal thickness at end-diastole; LA, left atrium; LV, left ventricle; LVIDd and LVIDs, left ventricular internal diameters at end-diastole and end-systole; LVOT, left ventricular outflow tract; MAPSE, mitral annular plane systolic excursion; PWTd, posterior wall thickness at end-diastole; RA, right atrium; RV, right ventricle; RVOT, right ventricular outflow tract; s′, peak systolic tissue Doppler velocity; TAPSE, tricuspid annular plane systolic excursion.
The parasternal long-axis plane passes through the long axis of the left ventricle and the centers of the mitral and aortic valves. In a correct view the septum and posterior wall run nearly horizontal and parallel, the cavity is elongated, and the apex lies off the screen; a steeply sloping septum or a round cavity indicates an oblique cut that enlarges linear dimensions. A correct apical four-chamber view shows a thin, tapered apical cap and the maximal left ventricular length without the outflow tract. The two-chamber view contains only the left ventricle and left atrium; a visible right ventricle means rotation is incomplete and the plane is not the orthogonal plane that biplane methods assume. The subcostal window uses the liver as an acoustic path and is often the best window in lung disease, after cardiac surgery, and during mechanical ventilation. Because the subcostal beam crosses the atrial septum nearly perpendicularly, apparent dropout at the fossa ovalis in apical views is confirmed or excluded there.
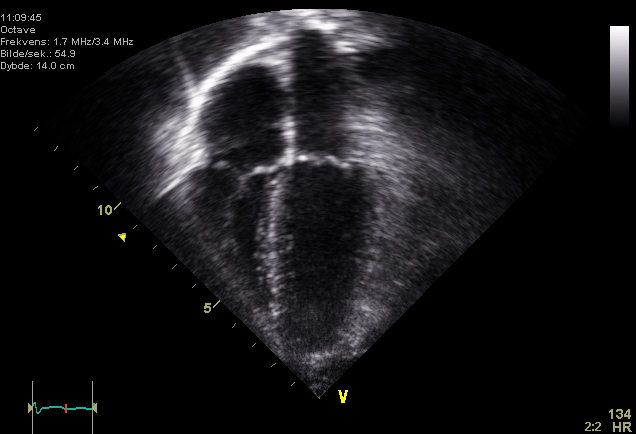

Image acquisition settings that change chamber measurements
| Setting | Effect of an incorrect setting on quantification | Standard |
|---|---|---|
| Overall and time-gain compensation | High gain thickens walls and reduces cavity dimensions and volumes; low gain causes dropout and inward tracing errors | Black blood pool with continuous endocardium |
| Depth | Excess depth reduces frame rate and the number of pixels across small structures | Structure of interest fills most of the display |
| Sector width and line density | A wide sector lowers frame rate and temporal resolution of end-systole | Narrowed to the chamber of interest |
| Focal zone | A focus above or below the region of interest blurs lateral borders | Placed at the level being measured |
| Frame rate | Too few frames per cycle misses true end-systole and impairs speckle tracking | About 50 to 90 frames per second for 2D strain |
| Harmonic imaging | Thicker-appearing walls and leaflets compared with fundamental imaging | Default in adults; apparent wall and leaflet thickening is allowed for when comparing with older fundamental-mode studies |
| Zoom | Unzoomed images enlarge the relative error of small linear measurements | Zoomed LVOT, aortic root, and annular measurements |
| Sweep speed (M-mode and Doppler) | Slow sweep compresses intervals and lowers caliper precision | Fast sweep with zoom for intervals and M-mode measurements |
Machine settings that change chamber measurements. The frame-rate range for strain is from the 2025 ASE/EACVI strain consensus.
Image quality is reported when it limits interpretation, and negative findings are stated only for regions the study evaluated. When window, anatomy, or the clinical question prevents an answer, even with an ultrasound-enhancing agent, the study proceeds to transesophageal echocardiography, cardiac magnetic resonance, or computed tomography.
Measurement conventions: frame timing, planes, and calipers
A measurement is valid only in the standardized plane, at the standardized moment of the cardiac cycle, and with the caliper convention used to derive its reference range. End-diastole is defined as the first frame after mitral valve closure or the frame in which the cavity dimension is largest. End-systole is the frame after aortic valve closure or the frame with the smallest cavity. Atrial volumes are measured at their maximum, in the last frame before mitral or tricuspid opening, which is ventricular end-systole. In sinus rhythm, representative beats are measured. In atrial fibrillation, several consecutive beats are averaged, or an index beat is chosen whose two preceding intervals are similar; the beat after a premature contraction is potentiated and is excluded.
| Measurement | View | Frame | Caliper convention |
|---|---|---|---|
| LV internal diameters and wall thickness | Parasternal long axis | End-diastole (LVIDs at end-systole) | Perpendicular to the LV long axis at the mitral leaflet tips; tissue–blood interface to tissue–blood interface; right ventricular trabeculation, chordae, and epicardial fat excluded |
| LV volumes | Apical four- and two-chamber | End-diastole and end-systole | Compacted myocardium traced; papillary muscles and trabeculations included in the cavity; annulus closed with a straight line; the longer of the two lengths used |
| LA volume | LA-focused apical four- and two-chamber | End-systole, frame before mitral opening | Pulmonary veins and appendage excluded; closed across the annular plane |
| RV diameters and areas | RV-focused apical four-chamber | End-diastole (areas also at end-systole) | Basal diameter in the basal third; trabeculations and moderator band included in the cavity |
| RA area and volume | RA-focused apical four-chamber | End-systole, frame before tricuspid opening | Venae cavae and RA appendage excluded |
| Aortic root and ascending aorta | Parasternal long axis, one interspace higher for the ascending aorta | End-diastole | Leading edge to leading edge, perpendicular to the aortic long axis |
| Aortic annulus and LVOT | Zoomed parasternal long axis | Mid-systole | Inner edge to inner edge at the hinge points |
| Inferior vena cava | Subcostal long axis | End-expiration, then sniff | Perpendicular to the long axis, 0.5 to 3.0 cm from the RA junction |
Plane, timing, and caliper conventions behind the reference ranges, from the 2015 ASE/EACVI chamber quantification recommendations and the 2025 ASE right heart guideline. A measurement made by a different convention is not graded against these ranges.
Linear measurements of the left ventricle
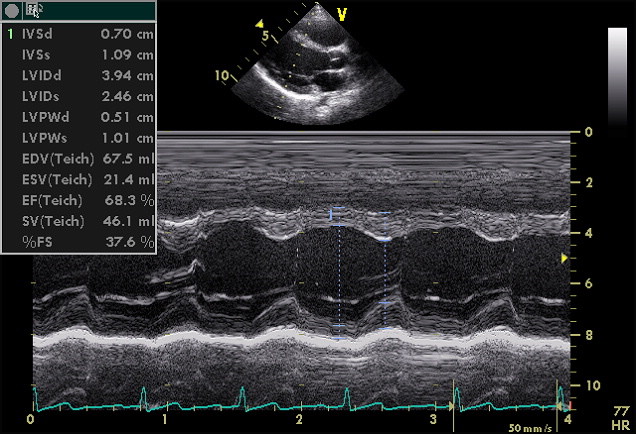
The left ventricular internal diameter at end-diastole (LVIDd) and end-systole (LVIDs), the interventricular septal thickness (IVSd), and the posterior wall thickness (PWTd) are measured in the parasternal long-axis view, perpendicular to the long axis of the ventricle at the level of the mitral leaflet tips. The 2015 ASE/EACVI recommendations accept direct two-dimensional measurement or an M-mode line guided by the two-dimensional image. M-mode offers very high temporal resolution, so the timing of end-diastole and end-systole is precise, but its line is often oblique to the walls. An oblique line lengthens every dimension by the reciprocal of the cosine of the angle; an obliquity of 25° alone turns a true 5.0 cm into 5.5 cm. When no window places the M-mode line perpendicular to the walls, the two-dimensional measurement is used.
A single thick measurement is checked in the short-axis view at the same level before it is reported.

| Parameter | Sex | Normal | Mildly abnormal | Moderately abnormal | Severely abnormal |
|---|---|---|---|---|---|
| LV diastolic diameter (cm) | Men | 4.2–5.8 | 5.9–6.3 | 6.4–6.8 | >6.8 |
| Women | 3.8–5.2 | 5.3–5.6 | 5.7–6.1 | >6.1 | |
| LV diastolic diameter/BSA (cm/m²) | Men | 2.2–3.0 | 3.1–3.3 | 3.4–3.6 | >3.6 |
| Women | 2.3–3.1 | 3.2–3.4 | 3.5–3.7 | >3.7 | |
| LV systolic diameter (cm) | Men | 2.5–4.0 | 4.1–4.3 | 4.4–4.5 | >4.5 |
| Women | 2.2–3.5 | 3.6–3.8 | 3.9–4.1 | >4.1 | |
| LV systolic diameter/BSA (cm/m²) | Men | 1.3–2.1 | 2.2–2.3 | 2.4–2.5 | >2.5 |
| Women | 1.3–2.1 | 2.2–2.3 | 2.4–2.6 | >2.6 | |
| Septal and posterior wall thickness (cm) | Men | 0.6–1.0 | 1.1–1.3 | 1.4–1.6 | >1.6 |
| Women | 0.6–0.9 | 1.0–1.2 | 1.3–1.5 | >1.5 |
Normal ranges and severity partitions for two-dimensional linear left ventricular measurements, ASE/EACVI 2015 (Supplemental Table 3). In healthy adults, LVIDd was 50.2 ± 4.1 mm (mean ± SD) in men and 45.0 ± 3.6 mm in women (ASE/EACVI 2015, Table 2). BSA, body surface area, calculated by the Mosteller formula in the reference cohorts.
Fractional shortening. Fractional shortening is (LVIDd − LVIDs) ÷ LVIDd × 100. It samples one line at the base and assumes the basal minor axis represents the whole ventricle, which holds only in a symmetric ventricle without regional dysfunction. After an anterior infarction with an apical aneurysm, basal shortening can be vigorous while global function is moderately reduced. Ejection fraction calculated from linear dimensions, including the Teichholz method, carries the same error and is not recommended for clinical use. A widened E-point septal separation on M-mode is a qualitative sign of a dilated, poorly contracting ventricle.
Left ventricular volumes and ejection fraction
Biplane method of disks. The biplane method of disks (modified Simpson rule) is the recommended two-dimensional method for left ventricular volumes. The endocardial border is traced in apical four- and two-chamber views at end-diastole and end-systole. The software divides the ventricle into 20 disks along its long axis, each with orthogonal diameters from the two views, and sums their volumes: V = (π/4) × Σ(aᵢ × bᵢ) × (L/20). The trace follows the compacted myocardium; papillary muscles and trabeculations are included in the cavity, and the annulus is closed with a straight line. The long-axis lengths in the two views should be similar. A clearly shorter length in one view identifies that view as foreshortened, and it is reacquired from the true apex, usually one interspace lower and more lateral. The 2015 recommendations use the longer of the two lengths. When only one apical view is usable, the area-length method estimates volume with the added assumption of a bullet-shaped ventricle.
Foreshortening removes volume and the region that often contracts least. Both volumes fall, and ejection fraction can rise. For example, a correctly aligned view measured 140 and 70 mL (ejection fraction 50%), and an acquisition one interspace higher measured 112 and 50 mL (55%). Automated tracing reproduces the error, because software follows the acquired border.
| Parameter | Sex | Normal | Mildly abnormal | Moderately abnormal | Severely abnormal |
|---|---|---|---|---|---|
| LV end-diastolic volume (mL) | Men | 62–150 | 151–174 | 175–200 | >200 |
| Women | 46–106 | 107–120 | 121–130 | >130 | |
| LV end-diastolic volume/BSA (mL/m²) | Men | 34–74 | 75–89 | 90–100 | >100 |
| Women | 29–61 | 62–70 | 71–80 | >80 | |
| LV end-systolic volume (mL) | Men | 21–61 | 62–73 | 74–85 | >85 |
| Women | 14–42 | 43–55 | 56–67 | >67 | |
| LV end-systolic volume/BSA (mL/m²) | Men | 11–31 | 32–38 | 39–45 | >45 |
| Women | 8–24 | 25–32 | 33–40 | >40 |
Biplane two-dimensional left ventricular volumes, ASE/EACVI 2015 (Table 2 and Supplemental Table 3). Single-plane apical four-chamber volumes are larger than biplane volumes (end-diastolic 2-SD ranges, men 37–93 mL/m² and women 30–82 mL/m²; ASE/EACVI 2015 Supplemental Table 2) and are graded only against their own ranges. All reference data were acquired without contrast.
Three-dimensional volumes. Three-dimensional echocardiography counts the enclosed cavity without a geometric assumption and does not foreshorten when the full ventricle is inside the pyramidal dataset. In patients with good image quality, the 2015 recommendations favor three-dimensional volumes and ejection fraction when available. Three-dimensional volumes are larger than biplane volumes and closer to magnetic resonance, but still smaller than magnetic resonance values, and their normal ranges differ between populations and software packages. The 2015 document did not set a single three-dimensional reference range; it summarized four population studies.
| Study (population) | EDVi men | EDVi women | ESVi men | ESVi women | EF men | EF women |
|---|---|---|---|---|---|---|
| Scandinavian cohort, 2010 (n = 166) | 66 (46–86) | 58 (42–74) | 29 (17–41) | 23 (13–33) | 57 (49–65) | 61 (49–73) |
| Japanese cohort, 2012 (n = 410) | 50 (26–74) | 46 (28–64) | 19 (9–29) | 17 (9–25) | 61 (53–69) | 63 (55–71) |
| UK cohort, 2012, White European (n = 978 in total) | 49 (31–67) | 42 (26–58) | 19 (9–29) | 16 (8–24) | 61 (49–73) | 62 (52–72) |
| UK cohort, 2012, Asian Indian | 41 (23–59) | 39 (23–55) | 16 (6–26) | 15 (7–23) | 62 (52–72) | 62 (52–72) |
| Italian cohort, 2013, White European (n = 226) | 63 (41–85) | 56 (40–78) | 24 (14–34) | 20 (12–28) | 62 (54–70) | 65 (57–73) |
Three-dimensional left ventricular reference values reproduced in the 2015 ASE/EACVI recommendations (Table 3). Values are mean (mean ± 2 SD); volumes in mL/m², ejection fraction in %. EDVi and ESVi, end-diastolic and end-systolic volume index.
Ejection fraction. Ejection fraction is (end-diastolic volume [EDV] − end-systolic volume [ESV]) ÷ EDV × 100, and both volumes must come from the same method and the same beat type. A single cutoff of 50% misclassifies a woman with 52% or 53%. Visual estimation by an experienced reader is reported as a range and serves as a safeguard against implausible automated values; when the clinical decision depends on the number, a measured ejection fraction is reported.
| Biplane left ventricular ejection fraction (LVEF) | Men | Women |
|---|---|---|
| Normal | 52–72% | 54–74% |
| Mildly abnormal | 41–51% | 41–53% |
| Moderately abnormal | 30–40% | 30–40% |
| Severely abnormal | <30% | <30% |
Biplane two-dimensional ejection fraction ranges and severity partitions, ASE/EACVI 2015 (Table 4). Normal means were 62 ± 5% in men and 64 ± 5% in women.
The 2022 American Heart Association/American College of Cardiology/Heart Failure Society of America (AHA/ACC/HFSA) heart failure guideline classifies ejection fraction to select therapy, not to grade the echocardiographic finding. The two scales are reported side by side without conversion.
| Heart failure category (2022 AHA/ACC/HFSA) | LVEF | Corresponding echocardiographic grade (ASE/EACVI 2015) |
|---|---|---|
| Heart failure with reduced ejection fraction (HFrEF) | ≤40% | Moderately or severely abnormal |
| Heart failure with mildly reduced ejection fraction (HFmrEF) | 41–49% | Mildly abnormal |
| Heart failure with preserved ejection fraction (HFpEF) | ≥50% | Mildly abnormal (50–51% in men, 50–53% in women) or normal |
| Heart failure with improved ejection fraction (HFimpEF) | Previous LVEF ≤40% and a follow-up measurement >40% | Graded on the current value |
Heart failure classification by ejection fraction, 2022 AHA/ACC/HFSA guideline. Management by category is covered on the heart failure with reduced ejection fraction page.
Ejection fraction is a ratio that depends on preload, afterload, and heart rate as well as on contractility. In severe mitral regurgitation the ventricle ejects part of its stroke volume backward into a low-pressure atrium, so ejection fraction can remain normal while forward stroke volume and myocardial function decline. A small, hypertrophied ventricle can also have a normal ejection fraction with a low stroke volume. End-systolic volume carries information that ejection fraction can conceal: when end-diastolic and end-systolic volumes enlarge together, ejection fraction changes little while the ventricle remodels.
Left ventricular mass and geometry
The linear method treats the ventricle as a prolate ellipsoid with uniform walls. It subtracts the cavity volume from the volume enclosed by the epicardium and multiplies the shell by myocardial density, with a correction derived from necropsy comparison:
LV mass (g) = 0.8 × {1.04 × [(IVSd + LVIDd + PWTd)³ − LVIDd³]} + 0.6
Dimensions are entered in centimeters at end-diastole. Because the dimensions are cubed, small errors are magnified: adding 1 mm to each wall in a woman with IVSd 1.0 cm, LVIDd 4.8 cm, and PWTd 0.9 cm raises the mass from 159 to 182 g and, at a body surface area of 1.70 m², moves the index from 93 g/m² (normal) to 107 g/m² (mildly increased). In asymmetric septal hypertrophy, apical hypertrophy, or a ventricle distorted by infarction, one line through the base does not represent the whole myocardium.
The two-dimensional area-length and truncated ellipsoid methods use epicardial and endocardial short-axis areas at the papillary muscle level with the long-axis length, and they tolerate regional distortion better. Their reference ranges are lower than those of the linear method, so a two-dimensional mass is never graded against linear thresholds. Three-dimensional mass requires no geometric assumption and agrees closely with magnetic resonance, but it needs a clear epicardial border and has limited reference data.
| Method and parameter | Sex | Normal | Mildly abnormal | Moderately abnormal | Severely abnormal |
|---|---|---|---|---|---|
| Linear: LV mass (g) | Men | 88–224 | 225–258 | 259–292 | >292 |
| Women | 67–162 | 163–186 | 187–210 | >210 | |
| Linear: LV mass/BSA (g/m²) | Men | 49–115 | 116–131 | 132–148 | >148 |
| Women | 43–95 | 96–108 | 109–121 | >121 | |
| 2D: LV mass (g) | Men | 96–200 | 201–227 | 228–254 | >254 |
| Women | 66–150 | 151–171 | 172–193 | >193 | |
| 2D: LV mass/BSA (g/m²) | Men | 50–102 | 103–116 | 117–130 | >130 |
| Women | 44–88 | 89–100 | 101–112 | >112 | |
| Relative wall thickness | Men | 0.24–0.42 | >0.42 is concentric | ||
| Women | 0.22–0.42 | >0.42 is concentric | |||
Left ventricular mass by the linear (cube) and two-dimensional methods, ASE/EACVI 2015 (Table 6 and Supplemental Table 3). The linear method is the best validated against necropsy and outcome data.
Relative wall thickness and geometry. Relative wall thickness is 2 × PWTd ÷ LVIDd. It compares wall thickness with cavity size, describes the shape of the ventricle, and is independent of mass. Combined with the mass index, it gives four geometric patterns. Relative wall thickness alone cannot establish hypertrophy, and mass alone cannot distinguish concentric from eccentric hypertrophy. Concentric remodeling is a normal mass with increased relative wall thickness and is not reported as hypertrophy.
| Relative wall thickness | Normal LV mass index | Increased LV mass index |
|---|---|---|
| ≤0.42 | Normal geometry | Eccentric hypertrophy (volume load: chronic aortic or mitral regurgitation, dilated cardiomyopathy, endurance training) |
| >0.42 | Concentric remodeling (aging, hypertension, underfilling) | Concentric hypertrophy (pressure load: hypertension, aortic stenosis; infiltrative and hypertrophic cardiomyopathy) |
Left ventricular geometry from mass index and relative wall thickness, ASE/EACVI 2015. The pattern itself does not establish the cause.
Body surface area, indexed chamber values, left ventricular mass, and stroke volume
Indexed chamber values, LV mass, geometry, and stroke volume
ASE/EACVI 2015 sex-specific partitionsBody surface area by the Mosteller formula, √(height in cm × weight in kg ÷ 3600), the formula used in the ASE/EACVI 2015 reference cohorts. LV mass by the linear (cube) formula; relative wall thickness (RWT) = 2 × PWTd ÷ LVIDd. Volumes are biplane; EDVi and ESVi are the end-diastolic and end-systolic volume indexes, LAVi is the left atrial volume index, and SVi is the stroke volume index. Stroke volume = π × (LVOT diameter ÷ 2)² × LVOT velocity-time integral (VTI); cardiac index = stroke volume × heart rate ÷ BSA. Grades use the sex-specific ASE/EACVI 2015 partitions; mass indexed to height2.7 is shown without a grade because the guideline partitions apply to BSA indexing.
Indexing to body surface area: limits in obesity, body-size extremes, age, and ethnicity
Volumes, mass, and some dimensions are divided by body surface area so that people of different size can be compared. The ASE/EACVI 2015 reference values were derived from healthy adults; the source studies excluded anyone with a body mass index above 30 kg/m², hypertension, diabetes, impaired kidney function, or dyslipidemia, and body surface area was calculated by the Mosteller formula. Indexed values are compared with the sex-specific range, because indexing does not remove the difference between men and women: at the same indexed end-diastolic volume of 72 mL/m², a woman's ventricle is moderately enlarged and a man's is normal.
Obesity. In severe obesity, body surface area rises with fat mass that adds little to cardiac size. A large absolute volume or mass can therefore index into the normal range, and left ventricular hypertrophy is underestimated. Indexing mass to height raised to an allometric power (1.7, 2.13, or 2.7) has advantages over body surface area for predicting events in obese patients, but most population data that define the guideline partitions are indexed to body surface area, and the 2015 recommendations retain it. At the extremes of body size, the report states both absolute and indexed values.
Small and very tall patients. In a small adult, an absolute diameter that looks normal can be enlarged for body size, and in a very tall adult a large absolute aortic diameter can be proportionate.
Age. Left ventricular volumes decline modestly with age, and ejection fraction changes little; in the Normal Reference Ranges for Echocardiography (NORRE) study, age-related differences persisted for most chamber parameters after indexing to body surface area. Age-specific nomograms for left ventricular dimensions and volumes are published with the 2015 recommendations. Diastolic indices, mitral annular velocities, MAPSE, and strain fall with age, and their age-specific ranges matter more than those of chamber size.
Ethnicity and nationality. The World Alliance Societies of Echocardiography (WASE) Normal Values Study enrolled 2,008 healthy adults in 15 countries. Dimensions and volumes were larger in men, and ejection fraction and GLS were higher in women. Significant intercountry variation in left ventricular size persisted after indexing to body surface area, with the largest volumes in Australia and the smallest in India. The WASE upper limits for volumes and lower limits for ejection fraction were higher than the guideline values. The investigators concluded that nationality should be considered when defining normal ranges for left ventricular volumes. The ASE/EACVI 2015 reference cohorts were predominantly White, and the document reports results by race and sex separately (Supplemental Table 5).
Regional wall motion and the 17-segment model
For regional function the left ventricle is divided into basal, mid, and apical levels. The basal and mid levels each have six segments, named counterclockwise from the anterior junction of the septum and right ventricular free wall as anteroseptal, inferoseptal, inferior, inferolateral, anterolateral, and anterior. The apical level has four segments (septal, inferior, lateral, and anterior), and the apical cap, segment 17, is the myocardium beyond the end of the cavity. The 17-segment model matches the AHA standard used by nuclear imaging, computed tomography, and magnetic resonance. The 2015 recommendations specify that the apical cap is not included when the 17-segment model is used for wall motion or regional strain. A 16-segment model, which divides the apex into four segments without a cap, is an accepted alternative for wall-motion scoring.
| Wall | Segments | Apical view | Usual coronary supply |
|---|---|---|---|
| Anterior | 1, 7, 13 | Two-chamber | LAD |
| Anteroseptal | 2, 8 | Three-chamber | LAD |
| Inferoseptal | 3, 9 | Four-chamber | RCA; the mid segment is often supplied by the LAD |
| Inferior | 4, 10 | Two-chamber | RCA, or LCx in a left-dominant circulation |
| Inferolateral | 5, 11 | Three-chamber | LCx or RCA |
| Anterolateral | 6, 12 | Four-chamber | LCx or LAD diagonal branches |
| Apical septal | 14 | Four-chamber | LAD |
| Apical inferior | 15 | Two-chamber | RCA, or LAD when it wraps the apex |
| Apical lateral | 16 | Four-chamber | LCx or LAD |
| Apical cap | 17 | All apical views | Usually LAD |
Segments, the apical view that displays each, and usual coronary supply, after the 2015 ASE/EACVI recommendations and the 2002 AHA segmentation statement. Coronary anatomy varies; the vessel that gives rise to the posterior descending artery determines supply to the inferior and inferolateral walls. LAD, left anterior descending; LCx, left circumflex; RCA, right coronary artery.
Each segment is graded by its systolic thickening and inward endocardial motion, and thickening decides the grade because a segment can be pulled inward passively by its neighbors or translated with the whole heart.
| Score | Term | Systolic behavior |
|---|---|---|
| 1 | Normal or hyperkinetic | Normal or increased thickening |
| 2 | Hypokinetic | Reduced thickening |
| 3 | Akinetic | Absent or negligible thickening (for example, scar) |
| 4 | Dyskinetic | Systolic thinning or stretching (for example, aneurysm) |
Wall-motion scores, ASE/EACVI 2015. An aneurysm is a morphologic entity, focal dilation and thinning with akinetic or dyskinetic deformation, and the 2015 recommendations no longer assign it a separate score.
The wall-motion score index is the sum of segment scores divided by the number of segments visualized. A normal ventricle scores 1.0. Unseen segments are excluded from both the sum and the count, and the segment model is stated with the index.
| Cause | Septal or regional pattern | Distinguishing feature |
|---|---|---|
| Left bundle branch block | Early inward septal flash, then outward rebound | Thickening usually preserved; timing abnormal; no anterior or apical abnormality |
| Right ventricular pacing | Early septal activation with similar motion | Pacing lead present; thickening preserved |
| After cardiac surgery | Anterior motion of the septum in systole | Normal septal thickening; whole-heart translation |
| RV volume overload | Septal flattening in diastole | Enlarged right ventricle; normal thickening |
| RV pressure overload | Septal flattening in systole | High RV systolic pressure |
| Constrictive pericarditis | Respiratory septal shift and early diastolic bounce | Pericardial thickening; respiratory variation in inflow |
| Myocarditis or stress cardiomyopathy | Abnormality that crosses coronary territories | Distribution not explained by one artery |
Regional wall motion without coronary ischemia. See the constrictive pericarditis page for the full echocardiographic criteria.
Global longitudinal strain and speckle tracking
Strain is deformation: the change in length of a segment relative to its length at end-diastole, (L − L₀) ÷ L₀ × 100. Longitudinal and circumferential shortening are negative and radial thickening is positive; a more negative longitudinal strain indicates greater shortening. Two-dimensional speckle-tracking echocardiography follows the natural acoustic pattern of the myocardium from frame to frame and calculates deformation in any direction within the image plane. It is less angle dependent than tissue Doppler strain, which measures deformation only along the beam, and it is the method used for clinical strain. The EACVI/ASE/Industry Task Force standardized the definitions in 2015, and the 2025 ASE/EACVI consensus statement sets the current clinical framework.
Acquisition and analysis. Global longitudinal strain (GLS) is the average longitudinal strain of all segments from the apical four-, two-, and three-chamber views. Each view includes the whole ventricle without foreshortening and has clear endocardial borders and a stable electrocardiogram. Frame rate is about 50 to 90 frames per second at resting heart rates. Aortic valve closure is marked from Doppler or the three-chamber view, and the default GLS value is end-systolic strain at aortic valve closure. The region of interest covers the myocardium; the midwall or full-thickness value is the contemporary standard, and endocardial strain has higher absolute values. Ectopic and postectopic beats are excluded. Segments whose tracking slides into the cavity or lags behind the wall on replay are corrected or excluded, even when the software labels them acceptable, and GLS is not reported when too many segments fail.
Bullseye (polar) map. Software displays segmental peak or end-systolic strain on a polar map with the base at the rim and the apex at the center, in the 17-segment layout shown above. Relative apical sparing, with reduced basal and mid strain and preserved apical strain, supports cardiac amyloidosis when it accompanies concentric wall thickening and compatible clinical findings, but it is not specific enough to diagnose amyloidosis alone; see the cardiac amyloidosis page. Reduced strain in the most hypertrophied segments suggests a hypertrophic cardiomyopathy phenotype, and reduced strain in one coronary territory with post-systolic shortening suggests ischemia or infarction. An isolated abnormal segment at one wall is most often a tracking failure. The 2025 consensus states that regional strain values show too much test-retest and intervendor variability for clinical use; the map is read for patterns, not segmental cutoffs.
| Measure | Normal | Borderline | Abnormal | Source |
|---|---|---|---|---|
| LV GLS (midwall or full thickness) | More negative than −18% | −16% to −18% | Less negative than −16% | ASE/EACVI 2025 |
| Serial LV GLS change | Relative change of 10% to 15% from baseline is likely significant | ASE/EACVI 2025 | ||
| RV free-wall longitudinal strain (magnitude) | >20% | Mild 15–20% | Moderate 11–<15%; severe <11% | ASE right heart 2025 |
| RV global longitudinal strain, six segments (magnitude) | >17% | Mild >13–17% | Moderate >9–13%; severe ≤9% | ASE right heart 2025 |
| LA reservoir strain | 30% to 60% | 23% to 30% | <23% | ASE/EACVI 2025 |
| LA reservoir strain in the diastolic algorithm | ≤18% supports elevated LV filling pressure | ASE diastolic 2025 | ||
Strain reference values. The 2025 strain consensus advises lower limits of normal for RV free-wall strain of −20% in men and −21% in women, slightly stricter than the right heart guideline's single 20% magnitude cutoff. LA, left atrial; RV, right ventricular.
Normal values depend on vendor and software version. Women have slightly more negative GLS than men, and GLS becomes less negative with age.
| Vendor and software | n | Mean GLS | Lower limit of normal |
|---|---|---|---|
| Meta-analysis, varying vendors | 2,597 | −19.7% | Not reported |
| GE EchoPAC BT 12 | 247 | −21.5% | −18% |
| GE EchoPAC 110.1.3 | 333 | −21.3% | −17% |
| Philips QLAB 7.1 | 330 | −18.9% | −14% |
| Toshiba Ultra Extend | 337 | −19.9% | −15% |
| Siemens VVI 1.0 | 116 | −19.8% | −11% |
| Esaote MyLab 50 | 30 | −19.5% | −13% |
Normal left ventricular GLS by vendor and software, from the studies reproduced in the 2015 ASE/EACVI recommendations (Supplemental Table 6). These older software versions illustrate the spread between platforms; the 2025 consensus categories apply to current midwall or full-thickness analysis.
Load dependence and serial comparison. Strain depends on loading. A rise in afterload, as in uncontrolled hypertension or severe aortic stenosis, makes GLS less negative without any change in intrinsic contractility. Serial GLS is compared as a relative change: a fall from −20% to −17% is an absolute change of 3 percentage points and a relative change of 15%. Serial studies use the same vendor, software version, views, and comparable loading; a change that coincides with a software change is attributed to method until reanalysis excludes it. Three-dimensional strain is not endorsed for clinical use.
Global longitudinal strain and ejection fraction in cancer therapy surveillance
Cancer therapy surveillance is the setting in which strain most directly changes management. Before potentially cardiotoxic therapy, a baseline study records ejection fraction, by three-dimensional echocardiography when image quality allows and otherwise by biplane volumes, together with GLS on the vendor and software that will be used for follow-up. The 2025 ASE/EACVI consensus states that strain should be performed at baseline in all patients receiving anthracyclines and that, after a relative decline in GLS of more than 12%, cardioprotective therapy is reasonable whatever the change in ejection fraction.
Asymptomatic cancer therapy-related cardiac dysfunction (CTRCD) is graded in the 2022 European Society of Cardiology (ESC) cardio-oncology guideline, which adopted the International Cardio-Oncology Society definitions. No ACC/AHA guideline defines CTRCD; the 2014 ASE/EACVI expert consensus defined it as a fall in ejection fraction of more than 10 percentage points to a value below 53% and regarded a relative GLS reduction of more than 15% as very likely abnormal.
| Asymptomatic CTRCD (ESC 2022) | Definition |
|---|---|
| Severe | New LVEF <40% |
| Moderate | New LVEF reduction of ≥10 percentage points to 40%–49%, or a reduction of <10 points to 40%–49% with a new relative GLS decline >15% or a new rise in cardiac biomarkers |
| Mild | LVEF ≥50% with a new relative GLS decline >15% and/or a new rise in cardiac troponin or natriuretic peptide |
Asymptomatic cancer therapy-related cardiac dysfunction, 2022 ESC cardio-oncology guideline. Symptomatic CTRCD is heart failure and is graded clinically. An LVEF of 38% is moderately abnormal by chamber quantification criteria and severe asymptomatic CTRCD by the ESC definition.
In the SUCCOUR trial, 331 anthracycline-treated patients with another heart failure risk factor were randomized to cardioprotective therapy guided by a relative GLS reduction of 12% or more, or by an absolute ejection fraction fall of more than 10%. The change in ejection fraction at one year, the primary outcome, did not differ between arms, but fewer patients in the GLS-guided arm met CTRCD criteria (5.8% versus 13.7%). The method of measuring ejection fraction matters for surveillance: in patients with stable function during chemotherapy, the temporal variability of ejection fraction was about 6 percentage points with noncontrast three-dimensional echocardiography and more than 10 points with two-dimensional methods.
Mitral annular plane systolic excursion and its reference values
Mitral annular plane systolic excursion (MAPSE) is the distance the mitral annulus travels toward the apex in systole, recorded by M-mode from the apical four-chamber view with the cursor through the septal or lateral annulus, or measured by speckle tracking. It reflects longitudinal fiber function and remains measurable when endocardial borders are poor. Mitral annular calcification, mitral surgery or repair, regional dysfunction near the sampled site, and loading all change it, and a low MAPSE after mitral surgery can coexist with a normal ejection fraction. Neither MAPSE nor annular systolic velocity (s′) is used alone to assign an ejection fraction. The ASE/EACVI 2015 recommendations do not set a MAPSE reference range; the largest population study reported the following values.
| Group | Septal M-mode (mm) | Lateral M-mode (mm) | Mean by speckle tracking (mm) |
|---|---|---|---|
| Men, all ages (n = 840) | 14.0 ± 2.5 (9) | 15.2 ± 2.6 (10) | 12.0 ± 2.4 (7) |
| Women, all ages (n = 1,112) | 14.0 ± 2.5 (9) | 15.7 ± 2.8 (10) | 12.4 ± 2.5 (8) |
| Men 18–29 years | 14.3 ± 2.5 (9) | 15.2 ± 2.7 (10) | 12.6 ± 2.3 (8) |
| Men ≥70 years | 13.4 ± 2.2 (9) | 14.9 ± 2.6 (10) | 10.9 ± 2.4 (6) |
| Women 18–29 years | 14.5 ± 2.4 (10) | 16.0 ± 2.7 (11) | 12.7 ± 2.6 (8) |
| Women ≥70 years | 12.8 ± 2.1 (9) | 14.9 ± 2.4 (10) | 10.7 ± 2.4 (6) |
MAPSE reference values in 1,952 healthy adults aged 18 to 80 years (a 2023 multicenter population study from 55 laboratories in China). Mean ± SD, with the lower limit of normal (2.5th percentile) in parentheses. Speckle-tracking values are lower than M-mode values, so each is graded against its own range.
Stroke volume, cardiac output, and Doppler principles
Doppler echocardiography measures blood velocity from the frequency shift of ultrasound reflected by moving red cells. The recorded velocity falls with the cosine of the angle between the beam and the flow, so misalignment only underestimates velocity: an intercept angle of 20° underestimates by about 6%. For this reason, high-velocity jets are recorded from several windows, the highest-velocity envelope that is dense and well defined is reported, and angle correction is not applied to valve jets. The simplified Bernoulli equation converts a peak velocity to a pressure gradient as 4v². Pulsed-wave Doppler samples velocity at a chosen depth and is limited by aliasing at high velocities; continuous-wave Doppler records the highest velocity along the whole beam without depth resolution.
Doppler stroke volume is the product of outflow tract cross-sectional area and the velocity-time integral (VTI) of flow through it: SV = π × (LVOT diameter ÷ 2)² × LVOT VTI. The outflow tract diameter is measured in mid-systole on a zoomed parasternal long-axis view, inner edge to inner edge, and the pulsed-wave sample is placed at the same level from the apical five-chamber or three-chamber view. Because the diameter is squared, a 1-mm error in a 2.0-cm outflow tract changes stroke volume by about 10%. Cardiac output is stroke volume × heart rate, and both are indexed to body surface area. A stroke volume index below 35 mL/m² defines low flow in the grading of aortic stenosis. In atrial fibrillation, the VTI is averaged over several consecutive beats and paired with the average heart rate of the same beats; pairing the beat after the longest cycle with the average rate overestimates output.
Doppler stroke volume measures forward flow, and volumetric stroke volume (EDV − ESV) measures total ejection. The difference between them is the regurgitant volume of mitral or aortic regurgitation in the absence of a shunt, a method set out in the 2017 ASE regurgitation guideline. The 2002 ASE Doppler quantification recommendations define the measurement of stroke volume, cardiac output, and the continuity equation. A peak aortic velocity below 2.0 m/s is normal, and with a bicuspid valve or aortic sclerosis it defines ACC/AHA stage A (at risk); and a peak tricuspid regurgitant velocity below 2.8 m/s is normal in the 2025 right heart guideline.
Left atrial volume and function
The parasternal anteroposterior diameter samples one dimension of an asymmetric chamber. The sternum in front and the spine and descending aorta behind limit anteroposterior growth, so a remodeling atrium enlarges mainly in its superior-inferior and mediolateral dimensions, and a normal diameter does not exclude enlargement. The maximum left atrial volume indexed to body surface area (LAVi) is the recommended measure. Volume is measured from left-atrium-focused apical four- and two-chamber views, which are acquired separately from the left-ventricle-focused views because the atrium is often foreshortened in those. The biplane method of disks is preferred; the area-length method, V = 0.85 × A₁ × A₂ ÷ L using the shorter of the two lengths, is an accepted alternative.
| Parameter | Men | Women | Abnormality grading |
|---|---|---|---|
| Maximum LA volume/BSA, biplane (mL/m²) | 16–34 | 16–34 | Mild 35–41; moderate 42–48; severe >48 |
| Anteroposterior diameter (cm) | 3.0–4.0 | 2.7–3.8 | Not graded; volume is the recommended measure |
| Anteroposterior diameter/BSA (cm/m²) | 1.5–2.3 | 1.5–2.3 | Not graded |
| Four-chamber area/BSA (cm²/m²) | 8.9 ± 1.5 | 9.3 ± 1.7 | Mean ± SD |
| Four-chamber volume/BSA, disks (mL/m²) | 24.5 ± 6.4 | 25.1 ± 7.2 | Mean ± SD; single-plane |
| Two-chamber volume/BSA, disks (mL/m²) | 27.1 ± 7.9 | 26.1 ± 6.7 | Mean ± SD; single-plane |
Left atrial size, ASE/EACVI 2015 (Table 4 and Supplemental Table 9). LAVi uses the same limits for men and women. Three-dimensional LA volumes are larger than biplane values and are not graded against these limits.
Left atrial volume integrates the effects of filling pressure, mitral valve disease, and rhythm over months and years and does not measure the pressure on the day of the study. After diuresis, a patient with heart failure can have normal filling-pressure markers and a persistently enlarged atrium. Enlargement also occurs without elevated pressure in trained athletes and high-output states, and atrial fibrillation enlarges the atrium by itself.
Left atrial strain. Atrial strain has reservoir, conduit, and contractile components. Reservoir strain is positive because the atrium lengthens while the ventricle contracts, and the contractile component is absent in atrial fibrillation. In a meta-analysis of 2,542 healthy adults, normal reservoir strain averaged 39%, conduit strain 23%, and contractile strain 17%. R-R gating, with zero at ventricular end-diastole, is the reference convention. The use of LAVi and reservoir strain to estimate filling pressure is covered on the diastolic function and HFpEF page.
Right ventricular size, wall thickness, and septal shape
The right ventricle has an inlet, an apical trabecular portion with the moderator band, and a smooth outlet, and it wraps around the left ventricle as a crescent. No single view contains the whole chamber and no simple geometric model describes it. The standard apical four-chamber view, centered on the left ventricle, cuts the right ventricle obliquely and underestimates its width. The RV-focused apical view keeps the left ventricular apex at the center of the sector while the transducer is moved laterally and rotated until the right ventricular base appears at its widest, and right ventricular diameters, areas, annular excursion, s′, and strain are measured there. The 2025 ASE right heart guideline replaced the 2010 ASE right heart guideline with updated normal values and severity grading, which are used in place of the right heart limits of the 2015 chamber document, and it requires at least one quantitative measure of right ventricular size, usually the basal diameter, in every report.
| Measure | Normal | Mild | Moderate | Severe |
|---|---|---|---|---|
| RV basal diameter (cm) | <4.1 | 4.1–4.4 | >4.4–4.9 | >4.9 |
| RV basal diameter/BSA (cm/m²) | <2.4 | 2.4–2.6 | >2.6–2.9 | >2.9 |
| RV mid diameter (cm) | <3.5 | 3.5–3.8 | >3.8–4.2 | >4.2 |
| RV longitudinal diameter (cm) | <8.2 | 8.2–8.9 | >8.9–9.6 | >9.6 |
| RVOT PLAX diameter (cm) | <3.3 | 3.3–3.5 | >3.5–3.9 | >3.9 |
| RVOT PSAX proximal diameter (cm) | <3.4 | 3.4–3.8 | >3.8–4.1 | >4.1 |
| RVOT PSAX distal diameter (cm) | <2.9 | 2.9–3.0 | >3.0–3.3 | >3.3 |
| RV free-wall thickness (cm) | <0.5 | 0.5–0.7 | >0.7–0.9 | >0.9 |
| RV end-diastolic area (cm²) | <25 | 25–28 | >28–32 | >32 |
| RV end-diastolic area/BSA (cm²/m²) | <14 | 14–15 | >15–17 | >17 |
| RV end-systolic area (cm²) | <14 | 14–16 | >16–19 | >19 |
| RV end-systolic area/BSA (cm²/m²) | <8 | 8–9 | >9–11 | >11 |
| 3D RV end-diastolic volume/BSA (mL/m²) | <90 | 90–103 | >103–115 | >115 |
| 3D RV end-systolic volume/BSA (mL/m²) | <41 | 41–48 | >48–55 | >55 |
| Main pulmonary artery diameter (cm) | <2.5 | 2.5–3.0 | >3.0–3.5 | >3.5 |
Right ventricular and pulmonary artery size, 2025 ASE right heart guideline (Table 1). Diameters and areas are measured at end-diastole (areas also at end-systole) in the RV-focused apical view; free-wall thickness is measured subcostally at end-diastole. The guideline gives a single set of limits for both sexes. PLAX, parasternal long axis; PSAX, parasternal short axis; RVOT, right ventricular outflow tract.
Increased free-wall thickness indicates chronic pressure load or a hypertrophic or infiltrative myopathy and is not specific for pulmonary hypertension.
Septal shape and loading. In the parasternal short-axis view at the papillary muscle level, the left ventricular eccentricity index is the ratio of the dimension parallel to the septum to the dimension perpendicular to it. It is 1 in both phases in a normal heart. An index above 1 at end-diastole indicates right ventricular volume overload (atrial septal defect, severe tricuspid or pulmonic regurgitation). An index above 1 at end-systole indicates pressure overload (pulmonary hypertension, pulmonic stenosis). Flattening in both phases indicates elevated pressure with or without volume overload.
Right ventricular systolic function
TAPSE and s′. Tricuspid annular plane systolic excursion (TAPSE) is recorded by M-mode in the RV-focused view, with the cursor through the lateral tricuspid annulus and parallel to its motion, from the end-diastolic to the peak systolic position. Lateral annular s′ is the peak systolic velocity of the same point by pulsed tissue Doppler, with the beam within about 20° of annular motion. Reference values come from pulsed recordings; color tissue Doppler velocities are lower and are not interchangeable. Both indices sample one basal point and describe longitudinal function only, and translation of the whole heart adds to annular motion.
Fractional area change. FAC is (end-diastolic area − end-systolic area) ÷ end-diastolic area × 100 in the RV-focused view. The endocardium is traced from the lateral annulus along the free wall to the apex and back along the septum, with trabeculations, the moderator band, and papillary muscles included in the cavity in both phases. FAC includes longitudinal and inward motion and tracks global function better than annular indices, but it excludes the outflow tract.
Myocardial performance index, strain, and three-dimensional ejection fraction. The right ventricular index of myocardial performance (RIMP) is (isovolumic contraction time + isovolumic relaxation time) ÷ ejection time. Raised right atrial pressure shortens isovolumic relaxation and can normalize the index despite dysfunction. Free-wall longitudinal strain averages the three free-wall segments and detects dysfunction earlier than annular indices; global right ventricular strain adds the three septal segments and has lower magnitudes. The right heart guideline states strain as absolute magnitude, so a free-wall value of −18% is graded as 18%, mildly reduced. Three-dimensional echocardiography is preferred for right ventricular volumes and ejection fraction when image quality allows; the dataset must include the inflow, apex, free wall, and outflow tract.
| Index | Normal | Mild | Moderate | Severe |
|---|---|---|---|---|
| TAPSE (cm) | >1.7 | ≤1.7 to >1.3 | ≤1.3 to >1.0 | ≤1.0 |
| Tissue Doppler s′ (cm/s) | >9.5 | ≤9.5 to >7.2 | ≤7.2 to >5.0 | ≤5.0 |
| Fractional area change (%) | >35 | ≤35 to >29 | ≤29 to >22 | ≤22 |
| 3D RV ejection fraction (%) | >45 | ≤45 to >39 | ≤39 to ≥32 | <32 |
| RV free-wall strain (magnitude, %) | >20 | ≤20 to ≥15 | <15 to ≥11 | <11 |
| RV global strain, six segments (magnitude, %) | >17 | ≤17 to >13 | ≤13 to >9 | ≤9 |
| RIMP, tissue Doppler | <0.55 | 0.55 to <0.62 | 0.62 to <0.70 | ≥0.70 |
| RIMP, pulsed Doppler | <0.40 | 0.40 to <0.49 | 0.49 to <0.57 | ≥0.57 |
Right ventricular systolic function, 2025 ASE right heart guideline (Table 1). The 2015 chamber document used abnormality thresholds of TAPSE <17 mm, s′ <9.5 cm/s, FAC <35%, 3D RVEF <45%, pulsed Doppler RIMP >0.43, and tissue Doppler RIMP >0.54; the pulsed Doppler RIMP limit is the one value that changed materially.
When the indices disagree. Discordant indices usually reflect loading, geometry, or technique, and the measure least affected by the specific problem decides. After cardiac surgery, TAPSE and s′ fall while FAC and three-dimensional ejection fraction stay normal, so global function is reported from the global indices. In severe tricuspid regurgitation, ejection into the low-pressure atrium maintains annular excursion, and TAPSE can remain normal while FAC, free-wall strain, and ejection fraction fall. Acute pressure overload, as in pulmonary embolism, dilates a thin-walled ventricle and lowers every index although the myocardium is not diseased.
Coupling to the pulmonary circulation. TAPSE divided by pulmonary artery systolic pressure is a simple index of right ventricular-pulmonary arterial coupling, with TAPSE entered in millimeters. The 2025 right heart guideline lists a ratio below 0.55 mm/mm Hg among the features of precapillary pulmonary arterial hypertension and associates a ratio below 0.3 to 0.4 mm/mm Hg with uncoupling and increased mortality. Pulmonary pressure estimation and pulmonary hypertension probability are covered on the pulmonary hypertension page.
Right atrial size, inferior vena cava, and right atrial pressure
The left-ventricle-focused apical view often cuts off the right atrial roof and underestimates size, so the right atrium is measured from a right-atrium-focused view. No standard orthogonal right atrial views exist, so volume is measured by the single-plane method of disks or the area-length method, and single-plane right atrial volumes are smaller than biplane left atrial volumes.
| Measure | Normal | Mild | Moderate | Severe |
|---|---|---|---|---|
| RA area (cm²) | <19 | 19–22 | >22–24 | >24 |
| RA volume/BSA, method of disks (mL/m²) | <30 | 30–36 | >36–41 | >41 |
| RA volume/BSA, area-length (mL/m²) | <33 | 33–38 | >38–44 | >44 |
| RA major dimension (cm) | <5.4 | 5.4–5.8 | >5.8–6.3 | >6.3 |
| RA minor dimension (cm) | <4.2 | 4.2–4.7 | >4.7–5.1 | >5.1 |
Right atrial size, 2025 ASE right heart guideline (Table 1). The 2015 ASE/EACVI document gave mean ± SD right atrial volume indices of 25 ± 7 mL/m² in men and 21 ± 6 mL/m² in women; the 2025 limits supersede them.
Inferior vena cava. The inferior vena cava is imaged subcostally in its long axis as it enters the right atrium, with the hepatic veins joining it. Its diameter is measured at end-expiration, perpendicular to the long axis, 0.5 to 3.0 cm from the atrial junction and distal to the hepatic vein, and collapse is observed with a sniff and with quiet respiration. M-mode improves timing, but the vessel can translate out of plane during respiration, which mimics collapse. The aorta lies posterior and to the patient's left, has a thicker wall, pulsates, and does not change with respiration; tracing the vessel into the right atrium settles its identity.
| IVC diameter | Collapse with sniff | Estimated RA pressure |
|---|---|---|
| ≤2.1 cm | ≥50% | 3 mm Hg (range 0–5) |
| Small and collapsed | — | Likely <3 mm Hg (hypovolemia) |
| ≤2.1 cm | <50% | Indeterminate: 8 mm Hg (range 5–10), refined by secondary indices |
| >2.1 cm | ≥50% | Indeterminate: 8 mm Hg (range 5–10), refined by secondary indices |
| >2.1 cm | <50% | 15 mm Hg (range 10–20) |
| >2.5 cm, no respiratory variation, with spontaneous contrast or color reflux | None | 20 mm Hg may be used |
Estimation of right atrial pressure from inferior vena cava size and collapse, 2025 ASE right heart guideline. Secondary indices include the hepatic vein systolic filling fraction (a value below 55% suggests elevated pressure), right atrial size, and tricuspid inflow and annular velocities.
The estimate is unreliable during positive-pressure ventilation, in which the vein is often dilated and does not collapse, although a diameter of 2.1 cm or less in an intubated patient accurately identifies a right atrial pressure below 10 mm Hg. In young athletes the inferior vena cava can be dilated with normal pressure. The estimated right atrial pressure is added to 4v² of the peak tricuspid regurgitant velocity to estimate right ventricular systolic pressure.
Right ventricular, right atrial, and left atrial measurements with estimated right atrial pressure
Right ventricle, atria, and right atrial pressure
ASE right heart 2025, ASE/EACVI 2015, ASE/EACVI 2025 strainEach entry is graded against the thresholds tabulated above: right ventricular size and function, right atrial size, and the inferior vena cava algorithm from the 2025 ASE right heart guideline; LA volume index from ASE/EACVI 2015; and LA reservoir strain from the 2025 ASE/EACVI strain consensus (partitions as tabulated above). RV free-wall strain may be entered as a negative value or as its magnitude, and it is graded by magnitude. Blank fields are not graded.
Aortic root and ascending aorta
The aortic root is measured at the annulus, the sinuses of Valsalva, and the sinotubular junction, and the tubular ascending aorta is measured at its widest point, with the distance from the annular plane reported. Leading-edge to leading-edge measurement is retained for the sinuses, sinotubular junction, and ascending aorta because the long-standing reference values and nomograms were derived that way. Measurements are taken perpendicular to the long axis of the aorta, which differs from that of the left ventricle; an oblique line overestimates the diameter, and a plane that misses the widest sinus of an asymmetric root underestimates it.
| Site | Men, absolute (cm) | Women, absolute (cm) | Men, indexed (cm/m²) | Women, indexed (cm/m²) |
|---|---|---|---|---|
| Annulus | 2.6 ± 0.3 | 2.3 ± 0.2 | 1.3 ± 0.1 | 1.3 ± 0.1 |
| Sinuses of Valsalva | 3.4 ± 0.3 | 3.0 ± 0.3 | 1.7 ± 0.2 | 1.8 ± 0.2 |
| Sinotubular junction | 2.9 ± 0.3 | 2.6 ± 0.3 | 1.5 ± 0.2 | 1.5 ± 0.2 |
| Proximal ascending aorta | 3.0 ± 0.4 | 2.7 ± 0.4 | 1.5 ± 0.2 | 1.6 ± 0.3 |
Aortic root dimensions in normal adults, mean ± SD, ASE/EACVI 2015 (Table 14). The sinus diameter is compared with age- and body-surface-area nomograms, because it increases with both; the 2015 document reproduces nomograms for adults aged 20 to 39 years and 40 years or older.
Echocardiography and computed tomography use different conventions, and a comparison across modalities or conventions is not a measure of growth. The ACC/AHA 2022 aortic guideline uses the ratio of maximal cross-sectional area to height for patients at extremes of body size: in an asymptomatic patient whose height is more than 1 SD above or below the mean, a ratio of 10 cm²/m or more makes surgery by experienced surgeons in a multidisciplinary aortic team reasonable (class 2a). Thresholds for surveillance and intervention, and the imaging of acute aortic syndromes, are covered on the acute aortic syndromes page.
Pulmonary pressure, diastolic function, valve severity, and pericardial effusion
Diastolic function and left atrial pressure are graded by the 2025 ASE algorithm on the diastolic function and HFpEF page. Pulmonary artery systolic pressure and the probability of pulmonary hypertension are graded on the pulmonary hypertension page. Aortic stenosis is graded on the aortic stenosis page, and regurgitant lesions by the 2017 ASE regurgitation guideline on the mitral regurgitation page. Prosthetic valve function is graded on the prosthetic heart valves page.
The pericardium is examined in every window. A pericardial effusion is measured as the echo-free space at end-diastole: small (less than 10 mm), moderate (10 to 20 mm), or large (more than 20 mm), in the ASE 2013 pericardial recommendations. Fluid seen only in systole is trivial. Size does not determine hemodynamic significance, because a small effusion that accumulates rapidly can cause tamponade; chamber collapse, respiratory variation in inflow, and a plethoric inferior vena cava establish the physiology. An echo-free space behind the left atrium is related to the descending aorta: pericardial fluid lies anterior to it, and pleural fluid posterior. Pericardial disease is covered on the acute and recurrent pericarditis and constrictive pericarditis pages.
Ultrasound-enhancing agents for endocardial definition
Ultrasound-enhancing agents are gas-filled microbubbles small enough to cross the pulmonary capillaries and opacify the left ventricular cavity. The 2015 chamber quantification recommendations and the 2018 ASE guideline indicate an enhancing agent when two or more contiguous left ventricular segments are not adequately visualized in apical views, to measure volumes and ejection fraction, assess regional wall motion, and detect apical thrombus, apical hypertrophy, noncompaction, and apical aneurysm or pseudoaneurysm. They are also used in stress echocardiography when endocardial definition is incomplete. Agents are imaged with contrast-specific, low mechanical index settings that preserve the bubbles.
Contrast moves the traced border outward to the true compacted myocardium. Contrast-enhanced volumes are larger than unenhanced volumes and closer to magnetic resonance values, and normal reference values for enhanced volumes are not well established. A fall in ejection fraction from 50% on a poorly bordered unenhanced study to 44% with a complete contrast-defined apex can reflect the method and not deterioration. The report states whether an agent was used, and serial studies use the same technique. High contrast concentration can shadow the basal segments. A negative statement about an unseen apex, such as "no thrombus," is unsupported; when the apex is not visualized, the limitation is stated.
Athletes, pregnancy, and older adults
Reference ranges describe sedentary, nonpregnant adults without cardiovascular risk factors. Training, pregnancy, and aging change chamber size and function, and a measurement is interpreted against the physiologic state of the person before it is attributed to disease.
Athletes. Endurance and mixed sports, such as rowing, cycling, and distance running, produce the largest and most balanced enlargement of both ventricles and both atria. Power training may favor a modestly concentric pattern. A large ventricle ejects a normal or high stroke volume with less fractional shortening, so elite endurance athletes can have low-normal or mildly reduced resting ejection fraction, fractional area change, or strain. Among 947 elite Italian athletes, the thickest left ventricular wall measured 16 mm. Only 16 (1.7%) had a wall of 13 mm or more, almost all rowers or canoeists, and all of them had enlarged cavities of 55 to 63 mm. A wall thickness above 16 mm with a nondilated cavity is therefore unlikely to be physiologic. The 2018 EAPC/EACVI position statement recommends multimodality imaging, including exercise imaging and magnetic resonance, when the resting echocardiogram is equivocal. The inferior vena cava and left atrium can be dilated with normal pressures.
| Feature | Favors athletic remodeling | Favors cardiomyopathy |
|---|---|---|
| LV cavity | Enlarged in proportion to wall thickness | Small (hypertrophic cardiomyopathy) or disproportionately dilated |
| Wall thickness | Mild, symmetric; rarely 13–16 mm | Asymmetric or focal; >16 mm |
| Outflow tract | No systolic anterior motion or obstruction | Systolic anterior motion with dynamic obstruction |
| Diastolic function | Normal or brisk e′ | Reduced e′; elevated filling-pressure markers |
| Right ventricle | Dilated with the left ventricle; global function | Regional dyskinesia or aneurysm |
| Exercise response | Augmentation of function | Blunted or paradoxical reserve |
| Other evidence | Regression with detraining | Scar on magnetic resonance; pathogenic variant; family history |
Echocardiographic features separating athletic remodeling from cardiomyopathy, after the 1991 elite-athlete data and the 2018 EAPC/EACVI position statement. No single feature decides; see the hypertrophic cardiomyopathy page.
Pregnancy. Cardiac output rises by as much as 45% by 24 weeks in a normal singleton pregnancy, from a higher stroke volume early and a higher heart rate later, while systemic vascular resistance falls. In serial studies of 51 women through each trimester, the left ventricle developed progressive eccentric hypertrophy that resolved postpartum. Ejection fraction did not change, while longitudinal strain became modestly less negative in late pregnancy (−19.5% to −17.6%) and returned to baseline after delivery. Every flow-dependent velocity and gradient rises with the higher output. As in all adults, two-dimensional echocardiographic volumes are smaller than magnetic resonance volumes, so serial studies in pregnancy use one modality. The inferior vena cava is commonly enlarged in pregnancy because of the increased blood volume, which limits its use for estimating right atrial pressure. The 2025 ESC pregnancy guideline sets the indications for echocardiography in pregnant women with heart disease.
| Variable | Normal pregnancy | Needs disease-specific evaluation |
|---|---|---|
| Chamber size | Mild, balanced enlargement | Disproportionate or progressive dilation |
| LV and RV function | Ejection fraction stable; GLS modestly less negative late | New LV or RV dysfunction |
| LV wall and mass | Mild eccentric increase in mass | Concentric hypertrophy |
| Pulmonary pressure | Stable | Raised systolic pressure; RV enlargement |
| Stenotic gradient | Rises with flow; valve area and dimensionless index constant | Falling valve area or dimensionless index |
| Aortic root | Little change | Growth on serial same-method studies |
Normal pregnancy compared with findings that require evaluation. Left ventricular dysfunction late in pregnancy or in the months after delivery raises the question of peripartum cardiomyopathy.
Older adults. With age, relaxation slows, e′ and the E/A ratio fall, wall thickness and relative wall thickness rise, left ventricular volumes fall modestly, and left atrial volume increases. Calcium accumulates in the aortic cusps, mitral annulus, and aorta. A basal septal bulge in an older hypertensive patient without obstruction or a family history does not by itself establish hypertrophic cardiomyopathy. The 2025 ASE diastolic guideline provides age-specific ranges for e′, and a healthy older adult can have e′ at or below the general cutoffs with normal left atrial pressure.
Comprehensive, limited, focused, stress, and transesophageal examinations
A comprehensive examination answers the full diagnostic question. A limited examination is of full diagnostic quality but restricted in scope, such as follow-up of a known effusion, and it is performed and reported to the laboratory standard. Focused cardiac ultrasound, defined by the ASE in 2013, is a bedside adjunct to the physical examination, often performed by the treating clinician with a handheld device, that answers narrow qualitative questions: global left ventricular function, gross right ventricular enlargement, pericardial effusion, and inferior vena cava size. A focused scan is never reported as a complete echocardiogram, and a normal focused scan does not exclude valve disease or regional dysfunction. Handheld devices often have smaller apertures, and some lack continuous-wave Doppler, calibrated measurement, electrocardiographic gating, or archiving. When the question requires a quantity the device cannot measure, the finding is described qualitatively and a diagnostic study follows.
Stress echocardiography adds exercise or dobutamine to resting imaging and detects ischemia as a new or worsening wall-motion abnormality in the 17-segment model. The 2020 ASE stress guideline sets the protocols and interpretation, and wall-motion analysis remains its primary endpoint; strain during stress requires frame rates likely above 100 frames per second. Transesophageal echocardiography, standardized by the 2013 ASE and Society of Cardiovascular Anesthesiologists (SCA) guideline, is used when transthoracic windows or the question exceed what the surface study can answer: atrial appendage thrombus, prosthetic valve and endocarditis complications, the atrial septum, the thoracic aorta, and procedural guidance. Chamber quantification norms apply to transthoracic imaging only.
Artificial intelligence-assisted measurement. Automated tracing and machine-learning software measure volumes, ejection fraction, strain, and linear dimensions. In a blinded randomized trial of 3,495 transthoracic studies, an initial AI assessment of ejection fraction was changed substantially (by more than 5 points) by the reviewing cardiologist less often than an initial sonographer assessment (16.8% versus 27.2%), meeting criteria for both noninferiority and superiority. Automated software follows the acquired image and does not correct foreshortening, an oblique plane, or a wrong frame, so the reader verifies plane, contour, and timing before accepting any automated value.
Appropriate use of transthoracic echocardiography
The 2011 American College of Cardiology Foundation (ACCF)/ASE appropriate use criteria rated indications on a 1-to-9 scale as appropriate (7 to 9), uncertain (4 to 6), or inappropriate (1 to 3). The 2019 ACC multimodality criteria for nonvalvular heart disease rate scenarios across echocardiography, nuclear imaging, magnetic resonance, and computed tomography as appropriate, may be appropriate, or rarely appropriate. The recurring principle is that repeat imaging is justified by a change in clinical status or a decision that depends on the result.
| Indication (2011 criteria) | Rating (score) |
|---|---|
| Symptoms or conditions potentially related to a cardiac cause, such as chest pain, dyspnea, palpitations, transient ischemic attack, stroke, or peripheral embolism | Appropriate (9) |
| Initial evaluation of known or suspected heart failure | Appropriate (9) |
| Re-evaluation of known heart failure with a change in clinical status or examination without a clear precipitating change in medication or diet | Appropriate (8) |
| Baseline and serial re-evaluation during therapy with cardiotoxic agents | Appropriate (9) |
| Syncope without other symptoms or signs of cardiovascular disease | Appropriate (7) |
| Routine surveillance (≥3 years) of mild valvular stenosis without a change in status | Appropriate (7) |
| Routine surveillance (≥1 year) of moderate or severe valvular stenosis without a change in status | Appropriate (8) |
| Routine surveillance (≥1 year) of heart failure without a change in status | Uncertain (6) |
| Routine surveillance (<1 year) of heart failure without a change in status | Inappropriate (2) |
| Routine surveillance (<3 years) of mild valvular stenosis without a change in status | Inappropriate (3) |
| Lightheadedness or presyncope without other symptoms or signs of cardiovascular disease | Inappropriate (3) |
| Infrequent atrial or ventricular premature contractions without other evidence of heart disease | Inappropriate (2) |
| Routine evaluation of systemic hypertension without symptoms or signs of hypertensive heart disease | Inappropriate (3) |
| Repeat evaluation of LV function after a prior study showed normal function, with no change in status | Inappropriate (1) |
Selected transthoracic echocardiography indications from the 2011 ACCF/ASE appropriate use criteria (Table 1). The 2019 multimodality criteria use the terms "may be appropriate" and "rarely appropriate" in place of "uncertain" and "inappropriate."
Sources of measurement error in chamber quantification
- Foreshortened apical views. A blunt, thick-walled apex and a shorter length in one view than the other indicate foreshortening, which reduces volumes, can raise ejection fraction, and biases apical strain.
- Oblique linear measurements. A sloping septum or round cavity in the long-axis view enlarges linear dimensions and the cubed mass calculation.
- Wrong frame. A mid-diastolic left atrial frame or a frame before true end-systole changes atrial and ventricular volumes. Long cycles in atrial fibrillation and potentiated postectopic beats overstate function.
- Method mismatch. Linear and two-dimensional mass, single-plane and biplane volumes, unenhanced and enhanced volumes, two- and three-dimensional values, and pulsed and tissue Doppler RIMP each have their own ranges. A serial change that coincides with a change of method, contrast, software, or vendor is attributed to method until the prior images are remeasured.
- Measurement variability. Two-dimensional ejection fraction can vary by more than 10 points between serial studies without a real change, compared with about 6 points for noncontrast three-dimensional ejection fraction. Changes smaller than the variability of the method are not called progression.
- Artifacts. Reverberation and near-field clutter can obscure the apex or mimic thrombus, side lobes can mimic masses, and acoustic shadowing from calcium or prostheses hides structures behind them. Each unexpected echo is confirmed in a second plane before it is described.
Reporting. The report gives each value with its method, the grade from the sex-specific partitions, and a synthesis: chamber size with its grade, wall thickness, mass with its grade and method, geometry, ejection fraction with its method, and the adjuncts used. Listing an increased mass index and a relative wall thickness of 0.48 without naming concentric hypertrophy is incomplete. The right heart section states right ventricular size and at least one quantitative systolic index, the inferior vena cava measurements with the estimated right atrial pressure, or the reason pressure cannot be estimated. Image quality, contrast use, and any limitation are stated so that later studies can be compared.
Self-assessment
A 58-year-old woman (height 160 cm, weight 64 kg) has IVSd 1.1 cm, LVIDd 4.6 cm, PWTd 1.1 cm, and biplane volumes of 96 mL and 46 mL. What are her LV mass index, relative wall thickness, geometric pattern, and ejection fraction grade by ASE/EACVI 2015 criteria?
Echocardiography Board ReviewReferences
- Lang RM, Badano LP, Mor-Avi V, et al. Recommendations for cardiac chamber quantification by echocardiography in adults: an update from the American Society of Echocardiography and the European Association of Cardiovascular Imaging. J Am Soc Echocardiogr. 2015;28:1–39.e14. doi:10.1016/j.echo.2014.10.003
- Mitchell C, Rahko PS, Blauwet LA, et al. Guidelines for performing a comprehensive transthoracic echocardiographic examination in adults: recommendations from the American Society of Echocardiography. J Am Soc Echocardiogr. 2019;32:1–64. doi:10.1016/j.echo.2018.06.004
- Mukherjee M, Rudski LG, Addetia K, et al. Guidelines for the echocardiographic assessment of the right heart in adults and special considerations in pulmonary hypertension: recommendations from the American Society of Echocardiography. J Am Soc Echocardiogr. 2025;38:141–186. doi:10.1016/j.echo.2025.01.006
- Nagueh SF, Sanborn DY, Oh JK, et al. Recommendations for the evaluation of left ventricular diastolic function by echocardiography and for heart failure with preserved ejection fraction diagnosis: an update from the American Society of Echocardiography. J Am Soc Echocardiogr. 2025;38:537–569. doi:10.1016/j.echo.2025.03.011
- Zoghbi WA, Adams D, Bonow RO, et al. Recommendations for noninvasive evaluation of native valvular regurgitation: a report from the American Society of Echocardiography developed in collaboration with the Society for Cardiovascular Magnetic Resonance. J Am Soc Echocardiogr. 2017;30:303–371. doi:10.1016/j.echo.2017.01.007
- Thomas JD, Edvardsen T, Abraham T, et al. Clinical applications of strain echocardiography: a clinical consensus statement from the American Society of Echocardiography developed in collaboration with the European Association of Cardiovascular Imaging of the European Society of Cardiology. J Am Soc Echocardiogr. 2025;38:985–1020. doi:10.1016/j.echo.2025.07.007
- Voigt JU, Pedrizzetti G, Lysyansky P, et al. Definitions for a common standard for 2D speckle tracking echocardiography: consensus document of the EACVI/ASE/Industry Task Force to standardize deformation imaging. J Am Soc Echocardiogr. 2015;28:183–193. doi:10.1016/j.echo.2014.11.003
- Porter TR, Mulvagh SL, Abdelmoneim SS, et al. Clinical applications of ultrasonic enhancing agents in echocardiography: 2018 American Society of Echocardiography guidelines update. J Am Soc Echocardiogr. 2018;31:241–274. doi:10.1016/j.echo.2017.11.013
- Heidenreich PA, Bozkurt B, Aguilar D, et al. 2022 AHA/ACC/HFSA guideline for the management of heart failure: a report of the American College of Cardiology/American Heart Association Joint Committee on Clinical Practice Guidelines. Circulation. 2022;145:e895–e1032. doi:10.1161/CIR.0000000000001063
- Isselbacher EM, Preventza O, Hamilton Black J III, et al. 2022 ACC/AHA guideline for the diagnosis and management of aortic disease: a report of the American Heart Association/American College of Cardiology Joint Committee on Clinical Practice Guidelines. Circulation. 2022;146:e334–e482. doi:10.1161/CIR.0000000000001106
- Douglas PS, Garcia MJ, Haines DE, et al. ACCF/ASE/AHA/ASNC/HFSA/HRS/SCAI/SCCM/SCCT/SCMR 2011 appropriate use criteria for echocardiography. J Am Soc Echocardiogr. 2011;24:229–267. doi:10.1016/j.echo.2010.12.008
- Doherty JU, Kort S, Mehran R, et al. ACC/AATS/AHA/ASE/ASNC/HRS/SCAI/SCCT/SCMR/STS 2019 appropriate use criteria for multimodality imaging in the assessment of cardiac structure and function in nonvalvular heart disease. J Am Coll Cardiol. 2019;73:488–516. doi:10.1016/j.jacc.2018.10.038
- Lyon AR, López-Fernández T, Couch LS, et al. 2022 ESC guidelines on cardio-oncology developed in collaboration with the European Hematology Association (EHA), the European Society for Therapeutic Radiology and Oncology (ESTRO) and the International Cardio-Oncology Society (IC-OS). Eur Heart J. 2022;43:4229–4361. doi:10.1093/eurheartj/ehac244
- Plana JC, Galderisi M, Barac A, et al. Expert consensus for multimodality imaging evaluation of adult patients during and after cancer therapy: a report from the American Society of Echocardiography and the European Association of Cardiovascular Imaging. J Am Soc Echocardiogr. 2014;27:911–939. doi:10.1016/j.echo.2014.07.012
- Thavendiranathan P, Negishi T, Somerset E, et al. Strain-guided management of potentially cardiotoxic cancer therapy (SUCCOUR). J Am Coll Cardiol. 2021;77:392–401. doi:10.1016/j.jacc.2020.11.020
- Thavendiranathan P, Grant AD, Negishi T, Plana JC, Popović ZB, Marwick TH. Reproducibility of echocardiographic techniques for sequential assessment of left ventricular ejection fraction and volumes: application to patients undergoing cancer chemotherapy. J Am Coll Cardiol. 2013;61:77–84. doi:10.1016/j.jacc.2012.09.035
- Yingchoncharoen T, Agarwal S, Popović ZB, Marwick TH. Normal ranges of left ventricular strain: a meta-analysis. J Am Soc Echocardiogr. 2013;26:185–191. doi:10.1016/j.echo.2012.10.008
- Wang YH, Sun L, Li SW, et al. Normal reference values for mitral annular plane systolic excursion by motion-mode and speckle tracking echocardiography: a prospective, multicentre, population-based study. Eur Heart J Cardiovasc Imaging. 2023;24:1384–1393. doi:10.1093/ehjci/jead187
- Asch FM, Miyoshi T, Addetia K, et al. Similarities and differences in left ventricular size and function among races and nationalities: results of the World Alliance Societies of Echocardiography Normal Values Study. J Am Soc Echocardiogr. 2019;32:1396–1406.e2. doi:10.1016/j.echo.2019.08.012
- Kou S, Caballero L, Dulgheru R, et al. Echocardiographic reference ranges for normal cardiac chamber size: results from the NORRE study. Eur Heart J Cardiovasc Imaging. 2014;15:680–690. doi:10.1093/ehjci/jet284
- Devereux RB, Alonso DR, Lutas EM, et al. Echocardiographic assessment of left ventricular hypertrophy: comparison to necropsy findings. Am J Cardiol. 1986;57:450–458. doi:10.1016/0002-9149(86)90771-X
- de Simone G, Daniels SR, Devereux RB, et al. Left ventricular mass and body size in normotensive children and adults: assessment of allometric relations and impact of overweight. J Am Coll Cardiol. 1992;20:1251–1260. doi:10.1016/0735-1097(92)90385-Z
- Mosteller RD. Simplified calculation of body-surface area. N Engl J Med. 1987;317:1098. doi:10.1056/NEJM198710223171717
- Cerqueira MD, Weissman NJ, Dilsizian V, et al. Standardized myocardial segmentation and nomenclature for tomographic imaging of the heart: a statement for healthcare professionals from the Cardiac Imaging Committee of the Council on Clinical Cardiology of the American Heart Association. Circulation. 2002;105:539–542. doi:10.1161/hc0402.102975
- Quiñones MA, Otto CM, Stoddard M, Waggoner A, Zoghbi WA. Recommendations for quantification of Doppler echocardiography: a report from the Doppler Quantification Task Force of the Nomenclature and Standards Committee of the American Society of Echocardiography. J Am Soc Echocardiogr. 2002;15:167–184. doi:10.1067/mje.2002.120202
- Klein AL, Abbara S, Agler DA, et al. American Society of Echocardiography clinical recommendations for multimodality cardiovascular imaging of patients with pericardial disease. J Am Soc Echocardiogr. 2013;26:965–1012.e15. doi:10.1016/j.echo.2013.06.023
- Pellikka PA, Arruda-Olson A, Chaudhry FA, et al. Guidelines for performance, interpretation, and application of stress echocardiography in ischemic heart disease: from the American Society of Echocardiography. J Am Soc Echocardiogr. 2020;33:1–41.e8. doi:10.1016/j.echo.2019.07.001
- Hahn RT, Abraham T, Adams MS, et al. Guidelines for performing a comprehensive transesophageal echocardiographic examination: recommendations from the American Society of Echocardiography and the Society of Cardiovascular Anesthesiologists. J Am Soc Echocardiogr. 2013;26:921–964. doi:10.1016/j.echo.2013.07.009
- Spencer KT, Kimura BJ, Korcarz CE, Pellikka PA, Rahko PS, Siegel RJ. Focused cardiac ultrasound: recommendations from the American Society of Echocardiography. J Am Soc Echocardiogr. 2013;26:567–581. doi:10.1016/j.echo.2013.04.001
- He B, Kwan AC, Cho JH, et al. Blinded, randomized trial of sonographer versus AI cardiac function assessment. Nature. 2023;616:520–524. doi:10.1038/s41586-023-05947-3
- Pelliccia A, Caselli S, Sharma S, et al. European Association of Preventive Cardiology (EAPC) and European Association of Cardiovascular Imaging (EACVI) joint position statement: recommendations for the indication and interpretation of cardiovascular imaging in the evaluation of the athlete's heart. Eur Heart J. 2018;39:1949–1969. doi:10.1093/eurheartj/ehx532
- Pelliccia A, Maron BJ, Spataro A, Proschan MA, Spirito P. The upper limit of physiologic cardiac hypertrophy in highly trained elite athletes. N Engl J Med. 1991;324:295–301. doi:10.1056/NEJM199101313240504
- Savu O, Jurcuţ R, Giuşcă S, et al. Morphological and functional adaptation of the maternal heart during pregnancy. Circ Cardiovasc Imaging. 2012;5:289–297. doi:10.1161/CIRCIMAGING.111.970012
- Sanghavi M, Rutherford JD. Cardiovascular physiology of pregnancy. Circulation. 2014;130:1003–1008. doi:10.1161/CIRCULATIONAHA.114.009029
- De Backer J, Haugaa KH, Hasselberg NE, et al. 2025 ESC guidelines for the management of cardiovascular disease and pregnancy. Eur Heart J. 2025;46:4462–4568. doi:10.1093/eurheartj/ehaf193
- Pathan F, D'Elia N, Nolan MT, Marwick TH, Negishi K. Normal ranges of left atrial strain by speckle-tracking echocardiography: a systematic review and meta-analysis. J Am Soc Echocardiogr. 2017;30:59–70.e8. doi:10.1016/j.echo.2016.09.007