Library › Hemodynamics › Right heart catheterization
Right heart catheterization and hemodynamic calculations
Right heart catheterization in adults: indications and technique, waveforms and normal values, cardiac output, resistance, shunt and valve calculations, and provocative testing.
Right heart catheterization measures right atrial, right ventricular, pulmonary artery, and wedge pressures, cardiac output, and blood oxygen saturations. Upper limits of normal at rest are a mean pulmonary artery pressure of 20 mm Hg, a wedge pressure of 12 mm Hg, and a pulmonary vascular resistance of 2 Wood units. Every derived value inherits the errors of its inputs, so the zero level, respiratory phase, wedge position, and cardiac output method are verified before any number is interpreted.
Indications for right heart catheterization
Right heart catheterization is performed to answer a defined hemodynamic question that noninvasive testing has not settled. The 2017 consensus document of the Society for Cardiovascular Angiography and Interventions and the Heart Failure Society of America (SCAI/HFSA) describes invasive hemodynamics as the reference standard for filling pressures, cardiac output, pulmonary vascular resistance, and intracardiac shunts. A 2026 American Heart Association (AHA) scientific statement standardizes the resting study and the provocative protocols that extend it. These include vasodilator challenges, volume loading, invasive exercise, and ramp studies in patients with left ventricular assist devices.
Right heart catheterization is required to diagnose pulmonary hypertension. The 7th World Symposium on Pulmonary Hypertension (WSPH, 2024) defines pulmonary hypertension as a mean pulmonary artery pressure above 20 mm Hg and separates precapillary from postcapillary disease by wedge pressure and pulmonary vascular resistance; classification and treatment are covered on the pulmonary hypertension page.
In heart failure, the 2022 AHA/American College of Cardiology (ACC)/HFSA guideline states that invasive hemodynamic monitoring can be useful to guide management in selected patients with persistent or worsening symptoms, signs, or diagnostic parameters in whom hemodynamics are uncertain (Class 2a). Routine invasive hemodynamic monitoring in patients with heart failure is not recommended (Class 3: No Benefit). The 2016 International Society for Heart and Lung Transplantation (ISHLT) listing criteria require right heart catheterization in all adult transplant candidates before listing and periodically until transplantation (Class 1). Listed patients have repeat studies every 3 to 6 months, especially with reversible pulmonary hypertension or worsening symptoms.
| Clinical question | What the study measures | Guidance |
|---|---|---|
| Suspected pulmonary hypertension | Mean pulmonary artery pressure, wedge pressure, cardiac output, PVR; vasoreactivity in selected PAH | Required for diagnosis (7th WSPH; 2022 ESC/ERS) |
| Heart failure with uncertain hemodynamics | Filling pressures, cardiac index, SVR, PVR | 2022 AHA/ACC/HFSA: Class 2a; routine use Class 3: No Benefit |
| Cardiogenic shock | Shock phenotype (left, right, or biventricular), cardiac power output, PAPi | Registry data associate complete profiling with lower mortality |
| Transplant and durable LVAD candidacy | PVR, TPG, reversibility with vasodilators; right ventricular reserve | 2016 ISHLT: before listing (Class 1); vasodilator challenge when criteria met (Class 1) |
| Unexplained exertional dyspnea | Exercise or volume-loaded wedge and pulmonary pressures | 7th WSPH; 2022 ESC/ERS; 2026 AHA statement |
| Suspected or known intracardiac shunt | Oximetry run, Qp/Qs, PVR for operability | 2025 ACC/AHA adult congenital heart disease guideline |
| Discordant valve severity | Simultaneous gradients, cardiac output, Gorlin valve area | 2020 ACC/AHA valve guideline: when noninvasive data are inconclusive or discordant |
| Pericardial versus myocardial restriction | Simultaneous right and left ventricular pressures with respiration | SCAI/HFSA 2017 |
PAH, pulmonary arterial hypertension; PVR, pulmonary vascular resistance; SVR, systemic vascular resistance; TPG, transpulmonary gradient; PAPi, pulmonary artery pulsatility index; LVAD, left ventricular assist device; ESC/ERS, European Society of Cardiology/European Respiratory Society.
Pulmonary artery catheter trials and use in critical care
The balloon-tipped, flow-directed catheter introduced in 1970 made bedside measurement of pulmonary artery and wedge pressures possible without fluoroscopy, and thermodilution cardiac output followed soon after. Its spread into routine intensive care preceded evidence of benefit, and randomized trials then tested catheter-guided management against clinical assessment.
ESCAPE enrolled 433 patients hospitalized with severe heart failure (mean ejection fraction 19%). They were assigned to therapy guided by clinical assessment plus a pulmonary artery catheter, targeting a wedge pressure of 15 mm Hg and a right atrial pressure of 8 mm Hg, or to clinical assessment alone. Days alive and out of hospital over 6 months did not differ (133 versus 135 days), mortality was similar (10% versus 9%), and in-hospital adverse events were more frequent with the catheter (21.9% versus 11.5%), none fatal. In PAC-Man, 1,041 critically ill patients in 65 UK intensive care units were assigned to management with or without a catheter. Hospital mortality was 68% and 66% (adjusted hazard ratio 1.09; 95% confidence interval 0.94 to 1.27). Insertion complications occurred in 46 of 486 patients who received a catheter, none fatal. In high-risk surgical patients aged 60 years and older, catheter-directed goal therapy did not reduce in-hospital mortality (7.8% versus 7.7%) and was associated with more pulmonary embolism (8 events versus 0).
These trials enrolled patients whom clinicians were willing to manage without a catheter. They do not address patients whose hemodynamics cannot be inferred at the bedside, the population in which the 2022 heart failure guideline supports invasive monitoring. In cardiogenic shock, observational data from the Cardiogenic Shock Working Group registry of 1,414 patients showed that complete hemodynamic profiling before mechanical circulatory support was associated with the lowest in-hospital mortality across SCAI shock stages. No profiling was associated with higher mortality (adjusted odds ratio 1.57; 95% confidence interval 1.06 to 2.33). The association is observational and subject to selection. Shock phenotypes and device selection are covered on the cardiogenic shock page.
Contraindications and complications of right heart catheterization
There are few absolute contraindications. Right heart catheterization through a mechanical tricuspid or pulmonary valve prosthesis is avoided, and a thrombus or tumor in the right atrium or ventricle and right-sided endocarditis are reasons not to pass a catheter through those chambers. Relative contraindications include coagulopathy at the planned access site, recently implanted right-sided pacing or defibrillator leads, and left bundle branch block, because catheter contact with the right bundle can produce complete heart block. When left bundle branch block is present, temporary pacing is available before the right ventricle is crossed.
In a multicenter series of 7,218 procedures in patients with pulmonary hypertension at experienced centers, serious adverse events occurred in 1.1% and procedure-related mortality was 0.055%. The most frequent complications were related to venous access (hematoma and pneumothorax), followed by arrhythmias and hypotensive episodes from vagal reactions or vasoreactivity testing.
- Access complications: hematoma, inadvertent arterial puncture, arteriovenous fistula, pseudoaneurysm, and pneumothorax with jugular or subclavian access. Ultrasound guidance reduces arterial puncture.
- Arrhythmias: atrial and ventricular ectopy while the catheter crosses the right heart, usually transient; catheter-induced right bundle branch block, which produces complete heart block in a patient with left bundle branch block.
- Pulmonary artery rupture: rare and frequently fatal. Risk rises with pulmonary hypertension, older age, anticoagulation, distal catheter migration, and balloon inflation in a small branch. Hemoptysis after wedging is treated as rupture until proved otherwise.
- Pulmonary infarction: from prolonged wedging or a catheter that has migrated distally and occludes a branch with the balloon deflated.
- Indwelling catheter complications: catheter-related bloodstream infection, thrombosis, valve injury, and knotting.
Balloon discipline prevents most pulmonary artery injury. The balloon is inflated only while the catheter advances with flow and is deflated before any withdrawal. A wedge is recorded with the smallest balloon volume that produces it, and the balloon is never left inflated.
Venous access and catheter course from vena cava to wedge
Femoral, internal jugular, and arm (basilic or cephalic) veins are all used. Femoral access accommodates large sheaths and several catheters for simultaneous left and right heart studies and balloon occlusion of an atrial septal defect. The course to the pulmonary artery more often needs fluoroscopy and a guidewire. Internal jugular access gives a short, direct route to the pulmonary artery and can be used at the bedside without fluoroscopy, though an arterial puncture in the neck is harder to compress. Arm access allows early mobilization and suits patients on anticoagulation. Sheaths up to 7 French are typical for basilic access and 6 French for cephalic access, and a hydrophilic wire or venogram may be needed in tortuous veins. Ultrasound guidance is used for jugular, femoral, and basilic punctures.
The standard balloon flotation catheter is 110 cm long and marked at 10-cm intervals. Its distal lumen opens at the tip and records pulmonary artery and wedge pressure and samples mixed venous blood. A proximal lumen opens about 30 cm from the tip in the right atrium, where it records right atrial pressure and receives the thermodilution injectate. A thermistor near the tip records the temperature curve. The balloon behind the tip holds 1.5 mL of air in the standard adult catheter.
From the right internal jugular vein, the right atrium is reached at about 20 cm, the right ventricle at 30 to 35 cm, the pulmonary artery at 40 to 45 cm, and the wedge position at about 50 cm; about 5 cm is added from the left internal jugular or left subclavian vein. A catheter that has advanced well beyond the expected depth without a new waveform is coiling, usually in the right atrium or ventricle, and is withdrawn with the balloon deflated. A dilated right heart commonly needs fluoroscopy, a deep inspiration, or a stiffening wire to enter the right ventricular outflow tract.
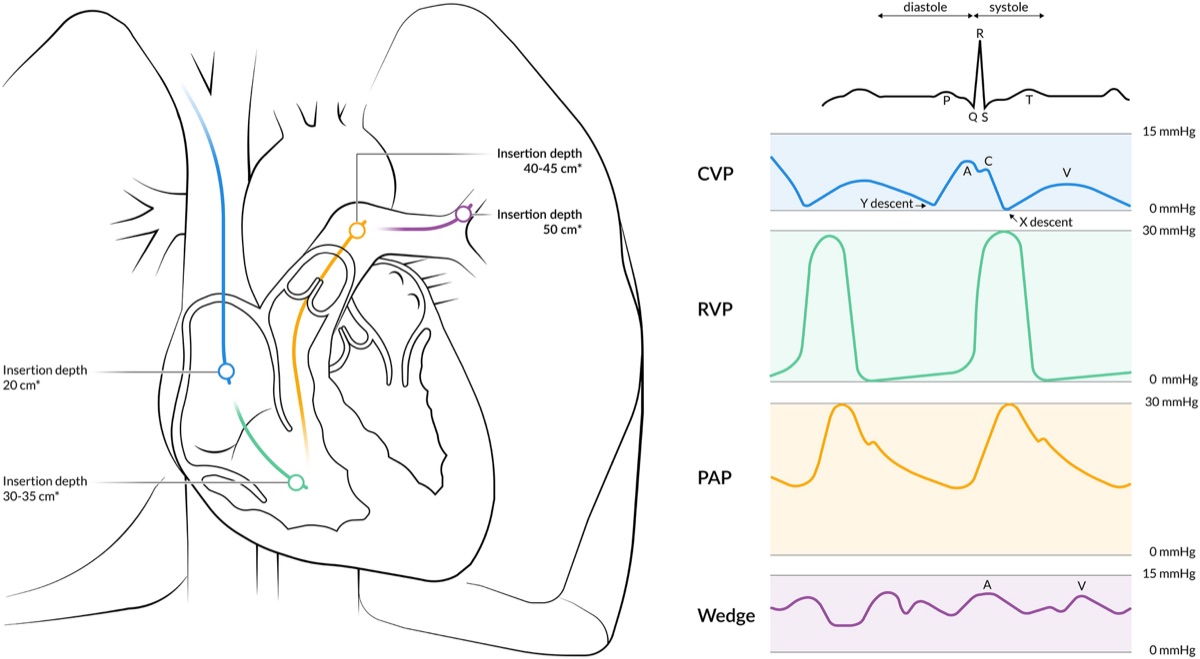
A complete diagnostic study records right atrial, right ventricular, pulmonary artery, and wedge pressures, a cardiac output, and saturations from the superior vena cava, the pulmonary artery, and a systemic artery. Additional samples from the inferior vena cava, right atrium, and right ventricle are taken when a shunt is possible. When the study includes left heart catheterization, left ventricular end-diastolic pressure is recorded simultaneously with wedge pressure, and the right heart study is completed before contrast is given, because contrast and sedation change loading conditions.
Zero reference, leveling, and damping of the pressure system
A fluid-filled transducer reports pressure relative to its own height. The transducer is opened to air and zeroed at the reference level of the heart, and the reference level is not moved during the study. A transducer placed too low adds the weight of the fluid column and overestimates every pressure; one placed too high underestimates every pressure. Because 1 cm of water equals 0.74 mm Hg, an error of 5 cm shifts all values by nearly 4 mm Hg, which is enough to move a patient across the 20-mm Hg pulmonary hypertension threshold or the 15-mm Hg wedge threshold.
The 7th WSPH and the 2022 ESC/ERS guideline specify the mid-thoracic level, halfway between the anterior sternum and the surface of the bed, as the zero reference in the supine position; it approximates the level of the left atrium. Other positions, including the semi-upright and upright positions used for exercise, use the intersection of the frontal plane at the mid-thoracic level, the transverse plane at the fourth anterior intercostal space, and the midsagittal plane. The phlebostatic axis, the fourth intercostal space at the mid-axillary line, is used at the bedside and lies about 5 cm below the sternal angle in a supine patient.
Damping. A catheter-transducer system resonates, and its fidelity depends on its natural frequency and damping coefficient. The fast-flush test opens the flush valve briefly and observes the oscillations as the tracing returns to baseline. An optimally damped system shows 1.5 to 2 oscillations. More oscillations indicate an underdamped system, which exaggerates systolic pressure, lowers diastolic pressure, and amplifies catheter whip. Fewer oscillations, or a slow return without oscillation, indicate an overdamped system, which lowers systolic pressure, raises diastolic pressure, and blunts the dicrotic notch while leaving the mean relatively preserved. Air bubbles, clot, kinked or compliant tubing, excessive tubing length, and a catheter tip against a vessel wall cause overdamping.
Respiration. Intrathoracic pressure is transmitted to every intracardiac pressure. During quiet spontaneous breathing, pleural pressure is closest to zero at end-expiration, and the 2022 ESC/ERS guideline specifies that all pressures, including wedge pressure, are measured at end-expiration without a breath-hold, because a breath-hold raises intrathoracic pressure. In obesity, chronic obstructive pulmonary disease, and during exercise, end-expiratory intrathoracic pressure may be positive, and averaging over three to four respiratory cycles avoids overestimating transmural pressure. When respiratory swings are large, the end-expiratory value and the respiratory average are both reported.
Positive-pressure ventilation. Applied or intrinsic positive end-expiratory pressure (PEEP) raises pericardial pressure and the recorded intracardiac pressures. Wedge pressure and right atrial pressure may not reflect transmural left and right atrial pressure when PEEP is 10 cm H₂O or more.
Normal pressure waveforms from right atrium to wedge
Right atrium. The right atrial tracing has three positive waves and two descents. The a wave follows the P wave and records atrial contraction. The c wave, often small and merged with the a wave, records tricuspid closure and bulging of the leaflets toward the atrium in early systole. The x descent records atrial relaxation and descent of the tricuspid annulus during ventricular ejection. The v wave peaks at the end of ventricular systole, after the T wave, as the atrium fills against a closed tricuspid valve. The y descent follows tricuspid opening and records early ventricular filling. In sinus rhythm the a wave is usually slightly taller than the v wave in the right atrium. Mean right atrial pressure approximates right ventricular end-diastolic pressure in the absence of tricuspid stenosis. Inspiration lowers right atrial pressure in a normal heart; a failure to fall or a rise with inspiration is the Kussmaul sign.
Right ventricle. The right ventricular tracing has a rapid systolic upstroke, a peak systolic pressure, a rapid fall to a diastolic minimum near zero, and a gradually rising diastolic pressure that ends with a small atrial kick before the next upstroke. End-diastolic pressure is read at the onset of the systolic upstroke, just after the a wave. Right ventricular systolic pressure equals pulmonary artery systolic pressure unless pulmonic or infundibular stenosis is present.
Pulmonary artery. The pulmonary artery tracing has a systolic peak similar to that of the right ventricle, a dicrotic notch at pulmonic valve closure, and a diastolic runoff that declines gradually. Systolic pressure does not identify catheter position, because it is the same in the right ventricle and pulmonary artery. The diastolic pressure identifies it: diastolic pressure rises abruptly when the catheter enters the pulmonary artery and declines through diastole, while the right ventricular diastolic pressure starts near zero and rises. Mean pulmonary artery pressure is taken from the electronically integrated waveform.
Wedge. With the balloon inflated in a distal branch, flow stops and the tip records pressure transmitted through a static column of blood from the pulmonary veins and left atrium. The wedge tracing resembles a damped left atrial tracing with a and v waves, but it is delayed relative to the electrocardiogram because the pressure crosses the pulmonary capillary bed. The wedge a wave therefore appears after the QRS complex, and the wedge v wave after the T wave. Mean wedge pressure is normally lower than pulmonary artery diastolic pressure by a few millimeters of mercury.
| Waveform feature | Mechanical event | Prominent or abnormal when |
|---|---|---|
| Tall a wave | Atrial contraction against a stiff ventricle or a narrowed atrioventricular valve | Right atrium: pulmonary hypertension, pulmonic stenosis, right ventricular hypertrophy, tricuspid stenosis. Wedge: mitral stenosis, stiff left ventricle |
| Cannon a wave | Atrial contraction against a closed atrioventricular valve | Atrioventricular dissociation: complete heart block, ventricular tachycardia, junctional rhythm |
| Absent a wave | No organized atrial contraction | Atrial fibrillation; flutter waves may be visible |
| Large v wave | Systolic filling of a noncompliant or regurgitant atrium | Right atrium: tricuspid regurgitation. Wedge: mitral regurgitation, a stiff left atrium, ventricular septal defect, heart failure |
| Blunted x descent | Systolic regurgitant inflow fills the atrium | Severe tricuspid or mitral regurgitation; atrial fibrillation |
| Steep y descent | Rapid early ventricular filling | Constriction, restrictive cardiomyopathy, right ventricular infarction, severe regurgitation |
| Blunted or absent y descent | Early diastolic filling impeded | Tamponade, tricuspid or mitral stenosis |
| Dip and plateau in the ventricle | Rapid early filling abruptly halted | Constriction and restriction; supportive, not discriminating |
Waveform features shared by the right atrium and the wedge (left atrial) tracing. Timing against a simultaneously recorded electrocardiogram identifies each wave; the wedge waves appear later than left atrial waves.
Normal hemodynamic values: pressures, flows, resistances, and saturations
In a systematic review of 1,187 healthy subjects studied by right heart catheterization, mean pulmonary artery pressure at rest was 14.0 ± 3.3 mm Hg, independent of sex and ethnicity and only slightly influenced by age and posture. Two standard deviations above the mean gives the upper limit of 20 mm Hg on which the current definition of pulmonary hypertension rests. The upper limit of normal for pulmonary vascular resistance is about 2 Wood units, which is also the lowest value associated with worse outcomes, and the upper limit of normal wedge pressure is 12 mm Hg. Normal values vary with volume status, and right atrial and wedge pressures in particular change with diuresis or hydration before the study.
| Site | Systolic (mm Hg) | Diastolic or end-diastolic (mm Hg) | Mean (mm Hg) |
|---|---|---|---|
| Right atrium | — | — | 2–6 |
| Right ventricle | 15–30 | End-diastolic ≤8 | — |
| Pulmonary artery | 15–30 | 4–12 | ≤20 (average 14) |
| Pulmonary artery wedge | — | — | ≤12 |
| Left atrium | — | — | ≤12 |
| Left ventricle | 90–140 | End-diastolic ≤12 | — |
| Aorta | 90–140 | 60–90 | 70–105 |
Resting supine adult values referenced to the mid-thoracic level and read at end-expiration. Pulmonary and wedge limits follow the 7th WSPH and the 2022 ESC/ERS guideline.
| Measurement | Formula | Normal range |
|---|---|---|
| Cardiac output | Thermodilution or Fick | 4–8 L/min |
| Cardiac index | Cardiac output ÷ body surface area | 2.5–4.0 L/min/m² |
| Pulmonary vascular resistance | (Mean PA pressure − wedge) ÷ cardiac output | ≤2 WU (≤160 dyn·s·cm⁻⁵) |
| Indexed PVR | PVR × body surface area | ≤2 WU × BSA (3.4 WU·m² at 1.7 m²) |
| Systemic vascular resistance | 80 × (mean arterial − right atrial pressure) ÷ cardiac output | 800–1,200 dyn·s·cm⁻⁵ |
| Transpulmonary gradient | Mean PA pressure − wedge | ≤12 mm Hg (historical threshold) |
| Diastolic pulmonary gradient | PA diastolic pressure − wedge | <7 mm Hg (historical threshold) |
| Oxygen consumption index | Measured by expired gas analysis | 125 mL/min/m² when assumed |
Resistances in Wood units (WU) multiplied by 80 give dyn·s·cm⁻⁵. PA, pulmonary artery.
| Sample site | Typical saturation | Comment |
|---|---|---|
| Superior vena cava | Close to mixed venous | Upper-body venous return; reference for an atrial-level step-up |
| Inferior vena cava | Usually higher than the superior vena cava (SVC) | Renal blood has low extraction; varies with sampling level |
| Right atrium, right ventricle | Close to mixed venous | Streaming makes single samples unreliable |
| Pulmonary artery (mixed venous) | 65–80% | True mixed venous sample after caval and coronary sinus blood mix |
| Wedge position | Close to systemic arterial | Confirms a true wedge |
| Systemic artery | ≥95% on room air | Lower values indicate lung disease, hypoventilation, or a right-to-left shunt |
Saturations are measured breathing room air when possible. Supplemental oxygen raises pulmonary venous and arterial dissolved oxygen and invalidates saturation-only shunt calculations.
Measuring and validating pulmonary capillary wedge pressure
Wedge pressure is the most consequential and the most error-prone measurement in a right heart study. It separates precapillary from postcapillary pulmonary hypertension, it is the numerator of every PVR, and in heart failure it guides diuresis. A valid wedge pressure meets four conditions. The tracing changes from a pulmonary artery waveform to an atrial waveform with recognizable a and v waves when the balloon is inflated and returns to a pulmonary artery waveform when it is deflated. Mean wedge pressure is lower than pulmonary artery diastolic pressure, unless large v waves are present. The value is stable over several beats and read at end-expiration. A blood sample withdrawn slowly from the distal lumen in the wedge position has a saturation close to systemic arterial saturation; the 2022 ESC/ERS guideline notes that saturations in the wedge position can confirm an accurate wedge pressure.
The catheter tip must lie in West zone 3, in which pulmonary arterial and venous pressures both exceed alveolar pressure, so that an uninterrupted column of blood links the tip to the left atrium. In zones 1 and 2, alveolar pressure compresses the vessels and the catheter records alveolar pressure. A zone 1 or 2 position is suggested by absent a and v waves, a wedge pressure that varies widely with respiration, and a pulmonary artery diastolic pressure that is lower than the wedge pressure without large waves. Hypovolemia and high PEEP enlarge zones 1 and 2. Balloon-tipped catheters usually flow to dependent, well-perfused zone 3 regions, and a lateral chest film confirms a tip position below the left atrium when this is in doubt.
Overwedging and underwedging. Overwedging occurs when the inflated balloon herniates over the tip or the tip abuts the vessel wall. The pressure then rises steadily without pulsation as the flush system pressurizes the occluded lumen. Overwedging is suggested by a pressure that exceeds pulmonary artery diastolic pressure and keeps rising until the balloon is deflated, by a nonpulsatile tracing, and by a wedge obtained with a small fraction of the balloon volume, which indicates distal migration. The catheter is withdrawn a few centimeters and the wedge is repeated. Underwedging, or partial occlusion, leaves pulmonary arterial pressure in the signal and produces a hybrid tracing that overestimates wedge pressure; the saturation of a sample in this position is close to mixed venous, not arterial.
Pulmonary artery diastolic pressure as a surrogate. Pulmonary artery diastolic pressure approximates wedge pressure only when pulmonary vascular resistance is normal and the heart rate is not fast. As resistance rises, the diastolic pressure increasingly exceeds the wedge pressure, so the surrogate fails precisely in patients with pulmonary vascular disease.
Which value is reported. Mean wedge pressure, averaged over the cardiac cycle at end-expiration, is used for PVR and for the classification of pulmonary hypertension. When a large v wave is present, the mean pressure is still the pressure that the pulmonary circulation faces. When wedge pressure is used as a surrogate for left ventricular end-diastolic pressure, the value at the a wave or at the time of the QRS complex is the comparable measurement, because it reflects left atrial pressure at end-diastole.
When wedge pressure differs from left atrial and left ventricular end-diastolic pressure
Wedge pressure estimates mean left atrial pressure. Left ventricular end-diastolic pressure is a single pressure at the end of diastole. The two agree when the mitral valve is normal, the left atrium is compliant, and the tip is in zone 3; otherwise they diverge, and the direction of the error is predictable from the cause.
In 2,270 patients with simultaneous measurements at one center, the mean difference between wedge pressure and left ventricular end-diastolic pressure was small (−1.6 mm Hg), but the interquartile range spanned −15 to 12 mm Hg, and the correlation was moderate (R = 0.6). Among patients with pulmonary hypertension, older age was associated with wedge pressure underestimating left ventricular end-diastolic pressure, while atrial fibrillation, rheumatic valve disease, and a larger left atrium were associated with overestimation. Discordance of this size can reclassify postcapillary pulmonary hypertension as precapillary disease.
| Setting | Relation of wedge to LVEDP | Mechanism |
|---|---|---|
| Mitral stenosis | Wedge higher | Diastolic gradient across the mitral valve |
| Severe mitral regurgitation, stiff left atrium | Mean wedge higher | Large v wave raises the mean; end-diastolic wedge is closer to LVEDP |
| Atrial fibrillation, large left atrium | Wedge higher | Associated with overestimation in clinical series |
| Pulmonary vein stenosis, pulmonary veno-occlusive disease, cor triatriatum | Wedge may be normal or misleading | Obstruction between the static column and the left atrium, or within small veins |
| Stiff, hypertrophied left ventricle | Wedge lower | Steep late-diastolic rise after atrial contraction raises LVEDP above mean left atrial pressure |
| Acute severe aortic regurgitation | Wedge lower | Left ventricular pressure exceeds left atrial pressure in late diastole and closes the mitral valve early |
| Positive-pressure ventilation, zone 1 or 2 position | Wedge higher | Alveolar pressure transmitted to the catheter tip |
LVEDP, left ventricular end-diastolic pressure. When the distinction changes the diagnosis, LVEDP or left atrial pressure (across a patent foramen ovale or atrial septal defect) is measured directly.
Large v waves. A v wave 10 mm Hg or more above the mean wedge pressure is conventionally called large. In 208 patients with wedge tracings and ventriculography, mitral regurgitation was the most common cause of a large v wave. However, 36% of large v waves occurred with no or trace regurgitation, including mitral stenosis, a mitral prosthesis, heart failure, and ventricular septal defect. Of 37 patients with severe regurgitation, 43% had large v waves and 32% had trivial ones, because a dilated, compliant left atrium absorbs the regurgitant volume. A large v wave in acute severe regurgitation, when the left atrium has not yet dilated, can approach the left ventricular systolic pressure. The height of the v wave therefore does not grade regurgitation; it reflects left atrial compliance and the regurgitant volume together. A giant v wave can be transmitted to the pulmonary artery tracing and make the wedge resemble a pulmonary artery waveform with a late peak; timing after the T wave identifies it.
Combined left and right heart catheterization. When coronary angiography or left ventricular pressure is part of the study, simultaneous wedge and left ventricular pressures define any transmitral gradient, and the left ventricular end-diastolic pressure resolves discordant wedge readings. Direct measurement is indicated when mitral stenosis, a prosthetic mitral valve, a large v wave, pulmonary venous obstruction, or a borderline wedge pressure leaves the phenotype uncertain. The 7th WSPH task force on left heart disease identified a wedge pressure of 12 to 18 mm Hg as a diagnostic gray zone in which the clinical phenotype, provocation, and direct left ventricular pressure are integrated before pulmonary hypertension is assigned to precapillary or postcapillary disease.
Oxygen content, mixed venous saturation, and oxygen delivery
Oxygen in blood is bound to hemoglobin and dissolved in plasma. Arterial oxygen content (CaO₂, mL O₂/dL) equals 1.36 × hemoglobin (g/dL) × saturation (as a fraction) plus 0.003 × arterial partial pressure of oxygen (PaO₂, mm Hg). Published constants for hemoglobin binding range from 1.34 to 1.39 mL O₂/g. The dissolved fraction is negligible breathing room air and becomes meaningful only at a high inspired oxygen fraction, when PaO₂ may exceed 300 mm Hg and adds about 1 mL/dL.
Oxygen delivery equals cardiac output multiplied by arterial oxygen content. Oxygen consumption equals cardiac output multiplied by the arteriovenous oxygen content difference. Rearranged, this is the Fick equation, and it shows that mixed venous saturation falls when output falls, hemoglobin falls, arterial saturation falls, or oxygen consumption rises. Mixed venous saturation is therefore not a measure of cardiac output; it measures the balance between delivery and consumption. A low value in a patient with normal hemoglobin and arterial saturation supports low output. A normal or high value does not exclude shock when peripheral extraction is impaired, as in sepsis, or when a left-to-right shunt contaminates the sample.
True mixed venous blood is sampled in the pulmonary artery, after superior vena caval, inferior vena caval, and coronary sinus blood have mixed. Central venous saturation from the superior vena cava or right atrium correlates imperfectly with it, and the two can diverge in either direction in shock. When a left-to-right shunt enters the right heart, the pulmonary artery sample no longer represents systemic venous return, and mixed venous saturation is estimated from caval samples, most often as (3 × superior vena cava + inferior vena cava) ÷ 4. Because the superior vena caval saturation carries most of the weight in this estimate, many laboratories use the superior vena caval value alone.
Cardiac output by thermodilution
Thermodilution applies indicator-dilution principles with cold as the indicator. A known volume of saline, usually 10 mL at room temperature or iced, is injected rapidly through the proximal lumen into the right atrium. The thermistor near the catheter tip records the fall and recovery of pulmonary artery blood temperature, and the computer calculates output from the Stewart-Hamilton relationship, which divides the indicator dose by the area under the temperature-time curve. A smaller area means faster washout and a higher output. Cardiac output varies by up to 10% with respiration, so three to five injections are made at a consistent respiratory phase and concordant values are averaged. Continuous thermodilution catheters heat a filament and report a moving average updated over several minutes; they trend output and do not detect abrupt changes.
Sources of error. Any process that reduces the curve area overestimates output, and any process that enlarges it underestimates output.
- Tricuspid regurgitation: regurgitant flow carries the injectate back and forth across the valve, prolongs the curve, and makes the result unreliable. The direction of the error is not predictable in an individual patient.
- Low output: slow washout and warming of the indicator by surrounding tissues distort the tail of the curve; accuracy falls as output falls.
- Intracardiac shunts: a left-to-right shunt causes early recirculation of indicator; a right-to-left shunt diverts indicator from the thermistor. Thermodilution is not used when a shunt is present.
- Injectate errors: an injected volume smaller than the programmed volume, a warmed injectate, or a slow injection overestimates output, because less cold reaches the thermistor.
- Rhythm and respiration: atrial fibrillation and large respiratory swings add beat-to-beat variability, which more injections reduce.
- Catheter position: a thermistor against the vessel wall or a proximal port still within the introducer sheath distorts the curve.
Cardiac output by the Fick principle
The Fick principle states that the oxygen taken up by the lungs equals pulmonary blood flow multiplied by the oxygen content difference across the lungs. Without a shunt, pulmonary and systemic flows are equal:
Cardiac output (L/min) = oxygen consumption (VO₂, mL/min) ÷ [(arterial − mixed venous oxygen content, mL/dL) × 10]. At the bedside: cardiac output = VO₂ ÷ [1.36 × hemoglobin × (SaO₂ − SvO₂) × 10], with arterial (SaO₂) and mixed venous (SvO₂) saturations as fractions. The factor of 10 converts deciliters to liters; omitting it inflates output tenfold.
Direct Fick. Oxygen consumption is measured by expired gas analysis with a metabolic cart, a hood, or a mouthpiece and nose clip. Arterial and pulmonary artery samples are drawn during the measurement in a steady state. The 7th WSPH task force calls the direct Fick method the gold standard for cardiac output. Its accuracy depends on a steady state and on correct sampling; it loses accuracy with high inspired oxygen, an air leak, and rapidly changing hemodynamics.
Indirect (assumed) Fick. Most laboratories do not measure oxygen consumption and substitute an estimate, most often 125 mL/min/m² of body surface area, or an equation based on age, sex, and heart rate. In two cohorts with measured resting oxygen uptake, measured and estimated values differed significantly (307 versus 260 mL/min), and 20% of estimates differed from the measured value by more than 25%. Error was larger in men and rose with body mass index, from a mean absolute difference of 37 mL/min below a body mass index of 25 to 92 mL/min at 40 or more. Because cardiac output is proportional to oxygen consumption, a 25% error in the estimate is a 25% error in output, and the same error carries into every resistance calculated from it. The 7th WSPH task force does not suggest the indirect Fick method for diagnosis.
Thermodilution versus estimated Fick. In 12,232 veterans with both measurements, estimated Fick and thermodilution cardiac indices had minimal mean difference but wide limits of agreement (−1.3 to 1.3 L/min/m²), and the two differed by more than 20% in 38% of patients. A low thermodilution cardiac index (below 2.2 L/min/m²) predicted 90-day and 1-year mortality more strongly than a low estimated Fick index, and a low estimated Fick index with a normal thermodilution index added no risk. The findings were replicated in a second academic cohort, and the authors concluded that thermodilution should be favored over estimated Fick.
| Feature | Direct Fick | Indirect (assumed) Fick | Thermodilution |
|---|---|---|---|
| Oxygen consumption | Measured | Estimated (125 mL/min/m² or equation) | Not used |
| Status | Reference method | Not suggested for diagnosis (7th WSPH) | Reliable alternative without a shunt |
| Intracardiac shunt | Measures pulmonary and systemic flow separately | Ratio valid; absolute flows uncertain | Not valid |
| Severe tricuspid regurgitation | Valid | Valid but subject to VO₂ error | Less reliable; direction of error unpredictable |
| Low output | Most accurate, because the oxygen difference is wide | Same advantage; same VO₂ error | Less accurate |
| Main error sources | Non-steady state, high FiO₂, sampling errors | Obesity, critical illness, fever, sepsis, mechanical ventilation | Injectate technique, rhythm, catheter position |
FiO₂, inspired oxygen fraction. When two methods disagree by more than about 20%, the method whose assumptions hold in the patient is reported, and the discrepancy is stated.
Internal consistency exposes a wrong output. In a patient in shock with severe tricuspid regurgitation, a right atrial pressure of 18 mm Hg, a mixed venous saturation of 48%, and a lactate of 5 mmol/L, a thermodilution output of 6.1 L/min cannot be correct when hemoglobin and arterial saturation are normal. A measured Fick output of 2.7 L/min (cardiac index 1.4 L/min/m²) is consistent with the rest of the profile.
Fick cardiac output and cardiac index
Measured or assumed oxygen consumptionArteriovenous difference (mL/L) = 1.36 × hemoglobin × (SaO₂ − SvO₂) × 10; dissolved oxygen is omitted. Example: an assumed VO₂ of 238 mL/min (125 × 1.9), hemoglobin 13.5 g/dL, and saturations of 96% and 62% give an arteriovenous difference of 62.4 mL/L, a Fick output of 3.80 L/min, and an index of 2.00 L/min/m², while a thermodilution output of 4.6 L/min differs from it by 19%.
Systemic and pulmonary vascular resistance and pulmonary gradients
Vascular resistance is the hydraulic form of Ohm's law: the pressure drop across a vascular bed divided by the flow through it. Pulmonary vascular resistance is (mean pulmonary artery pressure − mean wedge pressure) ÷ cardiac output, and systemic vascular resistance is (mean arterial pressure − right atrial pressure) ÷ cardiac output. With pressure in mm Hg and flow in L/min, the result is in Wood units; multiplying by 80 converts to dyn·s·cm⁻⁵. Indexed resistance multiplies the resistance by body surface area; dividing by it is a common arithmetic error.
PVR is a steady-flow measure. It assumes that the pressure drop is linear with flow and that the downstream pressure is the left atrial pressure estimated by the wedge. Both assumptions weaken at extremes. Recruitment and distension of pulmonary vessels lower PVR as flow rises, so PVR calculated in a high-output state can appear normal despite pulmonary vascular disease, and a falling output can raise calculated PVR without structural change. Errors in cardiac output and wedge pressure pass directly into PVR. An underestimated wedge pressure inflates the numerator, and an underestimated cardiac output inflates the result. A precapillary component is diagnosed only when wedge pressure and output have been validated.
Transpulmonary and diastolic pulmonary gradients. The transpulmonary gradient (mean pulmonary artery pressure − wedge) is the pressure drop across the lungs without correction for flow; values above 12 mm Hg were used to define "out-of-proportion" pulmonary hypertension, and a gradient of 15 mm Hg or more remains a criterion for vasodilator challenge in transplant candidates. The diastolic pulmonary gradient (pulmonary artery diastolic − wedge) was proposed as less flow-dependent and less sensitive to the height of the v wave, with values of 7 mm Hg or more indicating pulmonary vascular disease in left heart disease. Neither gradient appears in the 7th WSPH definitions, which use PVR above 2 Wood units to identify a precapillary component in both precapillary and combined postcapillary and precapillary pulmonary hypertension.
Pulmonary arterial compliance. Compliance, stroke volume ÷ pulmonary artery pulse pressure, describes the pulsatile load that resistance ignores. Because resistance and compliance are inversely related, compliance falls steeply with the first increases in resistance, and low compliance is associated with worse outcomes in pulmonary arterial hypertension and heart failure. A higher compliance during vasoreactivity testing was associated with a long-term response to calcium channel blockers in a multicenter series.
Systemic vascular resistance. SVR is interpreted against the clinical phenotype and has no single diagnostic cutoff. It is high when output falls and sympathetic tone rises, in cardiogenic and hypovolemic shock, and low in distributive shock, high-output states, and with vasodilator therapy. SVR guides the choice between vasodilator and vasopressor therapy in shock, but a calculated value carries the error of the cardiac output used to derive it.
Vascular resistance, gradients, and right ventricular indices
PVR, SVR, TPG, DPG, PAPi, cardiac power output, compliancePVR = (mPAP − PAWP) ÷ CO; SVR = 80 × (MAP − RAP) ÷ CO; TPG = mPAP − PAWP; DPG = PADP − PAWP; PAPi = (PASP − PADP) ÷ RAP; cardiac power output = MAP × CO ÷ 451; compliance = (CO ÷ heart rate) ÷ (PASP − PADP). The example (mPAP 34, PAWP 20, CO 4.0) gives a PVR of 3.5 WU (280 dyn·s·cm⁻⁵), a combined postcapillary and precapillary profile, an SVR of 1,320 dyn·s·cm⁻⁵, a PAPi of 2.50, and a cardiac power output of 0.69 W.
Right ventricular failure indices: pulmonary artery pulsatility index, cardiac power output, and right atrial to wedge ratio
Hemodynamic profiles. The Forrester subsets classified patients after myocardial infarction by a cardiac index above or below 2.2 L/min/m² and a wedge pressure above or below 18 mm Hg, separating normal, congested, hypoperfused, and combined profiles; the bedside warm-cold, wet-dry profiles of heart failure are their clinical counterpart. Right heart catheterization adds the relation between right and left filling pressures, which separates left ventricular, right ventricular, and biventricular failure and which the bedside examination cannot reliably make.
Right atrial to wedge pressure ratio. Normally the right atrial pressure is about half the wedge pressure or less. A ratio approaching or exceeding 1 indicates right ventricular failure out of proportion to left-sided filling pressure. In acute inferior infarction with proximal right coronary occlusion and suspected right ventricular dysfunction, the mean ratio was 0.81, compared with about 0.5 in controls. Among 484 recipients of a continuous-flow left ventricular assist device, a central venous to wedge pressure ratio above 0.63 independently predicted right ventricular failure after implantation (odds ratio 2.3). Concordantly high right and left pressures are also seen in tamponade, constriction, and restriction, which the waveform distinguishes.
Pulmonary artery pulsatility index (PAPi). PAPi is the pulmonary artery pulse pressure divided by right atrial pressure. It combines the stroke volume generated by the right ventricle, reflected in the pulse pressure, with its filling pressure. In acute inferior infarction, a PAPi of 0.9 or less identified in-hospital death or the need for percutaneous right ventricular support with 100% sensitivity and 98.3% specificity in a small cohort. In 85 recipients of a left ventricular assist device, a higher PAPi was independently associated with a lower risk of right ventricular assist device placement, and a threshold of 2.0 gave the best discrimination. Thresholds therefore depend on the population, and the numerator and denominator are read separately, because a low PAPi can reflect a narrow pulse pressure, a high right atrial pressure, or both.
Cardiac power output. Cardiac power output (watts) is mean arterial pressure × cardiac output ÷ 451, the hydraulic power delivered to the systemic circulation. In the SHOCK trial registry of 541 patients with cardiogenic shock, cardiac power output was the strongest independent hemodynamic correlate of in-hospital mortality (odds ratio 0.60 per 0.2 W increase). Cardiac power output, PAPi, and the right atrial to wedge ratio together define left, right, and biventricular shock phenotypes; their use in device selection is covered on the cardiogenic shock page.
Oxygen saturation run and shunt detection
An oximetry run detects and localizes a left-to-right shunt by finding the site at which oxygenated blood first raises the saturation of venous blood. It is performed when the pulmonary artery saturation is unexpectedly high (above about 75% breathing room air), when echocardiography suggests a shunt, when pulmonary hypertension or right heart enlargement is unexplained, and before defect closure. The run is performed breathing room air, or with the lowest oxygen that maintains saturation, and the samples are taken quickly in a steady state.
Samples are drawn from the left, right, and main pulmonary arteries; the right ventricle (outflow tract, mid-cavity, and inflow); the right atrium (low, mid, and high); the superior vena cava (SVC), high and low; the inferior vena cava (IVC) at the diaphragm; and a systemic artery. A pulmonary vein or left atrial sample is added when an atrial septal defect or patent foramen ovale is crossed.
The criteria for a significant step-up come from a 1980 methodological analysis of oxygen measurements in left-to-right shunts. An atrial-level shunt requires an increase of at least 7% between the mean caval saturation and the mean right atrial saturation. Ventricular-level and great-vessel shunts require an increase of at least 5% between the right atrium and right ventricle or between the right ventricle and pulmonary artery. The atrial threshold is higher because caval and coronary sinus blood of different saturations stream unevenly into the right atrium. Multiple samples at each level, averaged, are more reliable than any single value, and an isolated unexpected value is repeated before it is interpreted. Oximetry is insensitive to small shunts, which echocardiography with agitated saline, indicator-dilution curves, or cardiac magnetic resonance flow measurement detects.
| First step-up | Criterion (mean of samples) | Lesions |
|---|---|---|
| Superior vena cava | High SVC above low SVC | Sinus venosus defect, partial anomalous pulmonary venous return to the SVC |
| Right atrium | ≥7% above caval mixed venous | Secundum and primum atrial septal defect, anomalous pulmonary venous return to the right atrium, ruptured sinus of Valsalva into the right atrium, coronary artery fistula to the right atrium, left ventricle–right atrium (Gerbode) shunt |
| Right ventricle | ≥5% above right atrium | Ventricular septal defect, ruptured sinus of Valsalva into the right ventricle, coronary fistula to the right ventricle, primum defect with a cleft mitral valve regurgitating into the right atrium |
| Pulmonary artery | ≥5% above right ventricle | Patent ductus arteriosus, aortopulmonary window, anomalous coronary origin from the pulmonary artery |
| Inferior vena cava or low right atrium | Step-up at a low sample | Inferior sinus venosus defect, anomalous drainage to the IVC (scimitar syndrome) |
A right-to-left shunt produces systemic arterial desaturation that corrects incompletely with oxygen, and its level is localized by left-sided sampling.
Qp/Qs and shunt quantification
Pulmonary and systemic flows are each calculated by the Fick principle across their own capillary bed. Pulmonary flow (Qp) is VO₂ ÷ (pulmonary venous − pulmonary arterial oxygen content), and systemic flow (Qs) is VO₂ ÷ (systemic arterial − mixed venous oxygen content). Oxygen consumption cancels in the ratio:
Qp/Qs = (systemic arterial − mixed venous saturation) ÷ (pulmonary venous − pulmonary arterial saturation). The left-to-right shunt flow is Qp − Qs, and the right-to-left shunt flow is Qs minus effective pulmonary flow.
Because hemoglobin is the same in both circulations, saturations replace contents when dissolved oxygen is negligible. At a high inspired oxygen fraction, dissolved oxygen in pulmonary venous and arterial blood is substantial and the calculation uses contents including the dissolved term; a saturation-only calculation then misstates the ratio. Supplemental oxygen also lowers pulmonary vascular resistance, so studies for shunt quantification and operability are performed breathing room air when possible. The ratio is valid even when oxygen consumption is assumed, because the assumed value cancels; the absolute flows and the PVR derived from Qp are not.
When a shunt enters the right heart, mixed venous saturation is estimated from caval samples. For a shunt at the ventricular or great-vessel level, the right atrial saturation can serve as mixed venous. Pulmonary venous saturation is measured directly when the atrial septum is crossed. Otherwise, systemic arterial saturation is substituted when it is 95% or more. When systemic saturation is lower, the substitution is invalid until a right-to-left shunt has been separated from lung disease, and pulmonary venous blood is sampled directly.
Pulmonary vascular resistance in shunts. With a left-to-right shunt, PVR uses pulmonary flow: (mean pulmonary artery pressure − wedge or left atrial pressure) ÷ Qp. Systemic thermodilution output is invalid with a shunt and overestimates PVR when Qp exceeds Qs. Qp is calculated by the Fick principle, ideally with measured oxygen consumption, because this PVR decides operability.
Oximetry run and Qp/Qs
Step-up level and shunt ratio from saturationsMixed venous saturation = (3 × SVC + IVC) ÷ 4, or the SVC value when no IVC sample is entered. In the example, mixed venous saturation is 70%, the step-up is atrial, and Qp/Qs = (97 − 70) ÷ (97 − 81) = 1.69.
Pulmonary vascular resistance and operability of left-to-right shunts
A chronic left-to-right shunt raises pulmonary flow, and in some patients pulmonary arterial remodeling follows. As PVR rises, shunt flow falls, and a large defect can show a Qp/Qs close to 1 because the two circulations have balanced. Closing a defect whose shunt sustains a failing right ventricle in advanced pulmonary vascular disease removes a decompressing outlet and can be fatal. Catheterization therefore measures PVR, the shunt ratio, and systemic saturation before closure whenever pulmonary pressure is elevated by echocardiography.
The 2025 ACC/AHA adult congenital heart disease guideline recommends closure of a secundum atrial septal defect with a significant left-to-right shunt (Qp/Qs 1.5 or more) and right ventricular enlargement when PVR is 2 Wood units or less (Class 1). Closure is considered reasonable when PVR is above 2 and below 5 Wood units (Class 2a). When PVR is 5 to 8 Wood units, closure can be beneficial if targeted pulmonary arterial hypertension therapy lowers PVR below 5 Wood units (Class 2a). Ventricular septal defect closure is recommended when Qp/Qs is 1.5 or more with significant or progressive left ventricular dilation and no pulmonary arterial hypertension, and closure of a ventricular septal defect with Qp/Qs below 1.5 and no other indication is not recommended (Class 3: No Benefit). Closure of a patent ductus arteriosus may be considered when a PVR of 5 to 8 Wood units falls below 5 Wood units with targeted therapy (Class 2b), and it is not performed in Eisenmenger syndrome or with PVR above 10 Wood units. Closure of any intracardiac or vascular shunt in Eisenmenger syndrome is harmful (Class 3: Harm). The 2020 ESC adult congenital guideline uses 3 Wood units as its lower threshold: closure is recommended with PVR below 3 Wood units and considered between 3 and 5 Wood units.
Vasodilator testing in shunt lesions measures the fall in PVR and the rise in Qp/Qs with inhaled nitric oxide. A fall in PVR toward the closure thresholds supports operability. A temporary balloon occlusion of an atrial septal defect during catheterization shows the hemodynamic effect of closure directly: a rise in left atrial or wedge pressure on occlusion identifies a left ventricle that depends on the defect for decompression, as in older patients with diastolic dysfunction, and favors fenestrated closure or medical preparation.
Valve area by the Gorlin and Hakki formulas
Doppler echocardiography grades valve stenosis in nearly all patients. The 2020 ACC/AHA valve guideline reserves invasive measurement for patients in whom noninvasive testing is inconclusive or discordant with clinical findings. Invasive gradients are recorded with two transducers: simultaneous left ventricular and ascending aortic pressures for aortic stenosis, and simultaneous left ventricular and left atrial or wedge pressures for mitral stenosis.
Peak-to-peak and mean gradients. The catheter peak-to-peak gradient is the difference between peak left ventricular and peak aortic pressure, which occur at different times. It is not a physiologic instantaneous gradient and is lower than the Doppler peak instantaneous gradient. The mean gradient, the area between the simultaneous pressure curves divided by the ejection period, is the comparable measurement. A pullback from left ventricle to aorta localizes the gradient (subvalvular, valvular, or supravalvular) but does not measure it accurately, because the gradient changes between the beats compared. Pulmonic and infundibular gradients are localized by a right ventricle to pulmonary artery pullback. In mitral stenosis, the wedge tracing is delayed and damped relative to left atrial pressure. It is phase-shifted to align with the left ventricular tracing and overestimates the gradient in some patients, so transseptal left atrial pressure is preferred when accuracy matters.
The Gorlin formula derives orifice area from flow and the square root of the mean gradient:
Valve area (cm²) = cardiac output (mL/min) ÷ [heart rate × ejection or filling period (s/beat) × 44.3 × C × √mean gradient (mm Hg)]. C is 1.0 for the aortic valve and 0.85 for the mitral valve (constant 37.7). Hakki simplification: area ≈ cardiac output (L/min) ÷ √mean or peak-to-peak gradient.
The systolic ejection period runs from aortic valve opening to closure on the simultaneous pressure tracings; the diastolic filling period runs from mitral opening to end-diastole. Flow per second of valve opening, not cardiac output per minute, is the true determinant of the gradient. Tachycardia shortens diastole more than systole, so it raises the transmitral gradient at a fixed area.
Limitations. The Gorlin constant was derived empirically, and the formula underestimates valve area at low flow, which exaggerates severity in low-output states. Cardiac output measurement error enters the area directly. With coexisting regurgitation, the forward cardiac output understates transvalvular flow, and the Gorlin area underestimates the anatomic area; angiographic total stroke volume corrects this. Pressure recovery in a small aorta, catheter entrapment in a small ventricle, and pullback instead of simultaneous recording also cause disagreement with the Doppler continuity area. The Hakki formula correlated closely with the Gorlin formula in 100 patients (r = 0.96 for aortic and 0.94 for mitral stenosis) and assumes a heart rate in the normal range. Low-flow, low-gradient aortic stenosis and dobutamine testing are covered on the aortic stenosis page.
Gorlin and Hakki valve area
Aortic or mitral stenosisSevere stenosis: aortic valve area 1.0 cm² or less; mitral valve area 1.5 cm² or less (2020 ACC/AHA valve guideline). Example: cardiac output 5.0 L/min, heart rate 70, ejection period 0.33 s, and mean gradient 50 mm Hg give a transvalvular flow of 216 mL/s, a Gorlin area of 0.69 cm², and a Hakki area of 0.71 cm².
Acute vasoreactivity testing in pulmonary arterial hypertension
Acute vasoreactivity testing identifies the small group of patients with pulmonary arterial hypertension whose disease responds to high-dose calcium channel blockers. The 7th WSPH task force and the 2022 ESC/ERS guideline restrict it to idiopathic, heritable, and drug- or toxin-associated pulmonary arterial hypertension. In other forms of pulmonary arterial hypertension and in other groups, an acute response is misleading and true long-term responders are rare. In left heart disease, pulmonary vasodilation raises flow into a left heart with high filling pressure and can provoke pulmonary edema.
A positive acute response to inhaled nitric oxide is a fall in mean pulmonary artery pressure of at least 10 mm Hg to an absolute value below 40 mm Hg, with cardiac output unchanged or increased (7th WSPH). The 2022 ESC/ERS guideline states the absolute value as 40 mm Hg or less. About 12% of patients with idiopathic or drug-associated pulmonary arterial hypertension and fewer than 5% with heritable disease have a positive acute response. In a series of 557 patients with idiopathic disease tested with epoprostenol or nitric oxide, 12.6% responded acutely by an earlier definition (a fall of more than 20% in both mean pulmonary artery pressure and PVR) and received calcium channel blockers, but only 6.8% had a sustained response after at least 1 year on monotherapy. Long-term responders had a larger fall in mean pressure during testing (39% versus 26%) and reached a lower absolute value (33 versus 46 mm Hg). The 7th WSPH classification reintroduced long-term responders to calcium channel blockers as a subgroup of idiopathic pulmonary arterial hypertension, and responders are reassessed, including repeat right heart catheterization, after several months of therapy.
| Agent | Route | Half-life | Dose | Duration |
|---|---|---|---|---|
| Nitric oxide (preferred) | Inhaled | 15–30 s | 10–20 ppm | 5–10 min, single step |
| Iloprost | Inhaled | 30 min | 5–10 µg at the mouthpiece | 10–15 min, single step |
| Epoprostenol | Intravenous | 3 min | 2–12 ng/kg/min | 10 min per step, increments of 2 ng/kg/min |
Adapted from the 2022 ESC/ERS pulmonary hypertension guideline, Table 12. Intravenous adenosine is no longer recommended because of frequent side effects. Calcium channel blockers are not used empirically, without a positive test, because of the risk of hypotension and right ventricular failure.
A fall in PVR with a rise in cardiac output and an unchanged mean pressure is not a positive response, because the definition requires the pressure criteria.
Vasodilator challenge before heart transplantation and ventricular assist device implantation
Elevated PVR in a transplant candidate predicts right ventricular failure of the donor heart, which is unconditioned to a high afterload, and early post-transplant death. The 2016 ISHLT listing criteria recommend a vasodilator challenge when pulmonary artery systolic pressure is 50 mm Hg or more and either the transpulmonary gradient is 15 mm Hg or more or PVR is above 3 Wood units (Class 1). Systolic arterial pressure is maintained above 85 mm Hg during the challenge. When an acute challenge fails, hospitalization with continuous hemodynamic monitoring follows, because PVR often declines after 24 to 48 hours of diuretics, inotropes, and vasoactive agents such as inhaled nitric oxide (Class 1). When medical therapy fails to achieve acceptable hemodynamics, a left ventricular assist device can lower PVR over months by unloading the left atrium, and the patient is reassessed.
Nitroprusside is commonly used for the acute challenge in left heart disease, because it lowers left ventricular afterload and wedge pressure and so separates a passive from a fixed component of PVR; inhaled nitric oxide, milrinone, and dobutamine are alternatives. A fall in PVR to the transplant range with a rise in cardiac output, at a systemic pressure that the patient tolerates, identifies reversible pulmonary hypertension. Pulmonary hypertension that does not reverse despite these measures is a relative contraindication to heart transplantation alone.
Before durable left ventricular assist device implantation, the study defines right ventricular reserve. A high right atrial pressure, a right atrial to wedge ratio above about 0.63, a low PAPi, and low right ventricular stroke work index predict right ventricular failure after implantation, and patients are optimized with diuresis and inotropes before surgery. After implantation, hemodynamic ramp studies record pressures and output across pump speeds to set the speed, assess right ventricular function, and evaluate myocardial recovery.
Fluid challenge and exercise right heart catheterization
Resting hemodynamics measured after fasting, diuresis, and sedation can be normal in patients whose symptoms arise from abnormal left-sided filling pressure or pulmonary vascular disease during exertion. Provocation tests reproduce the stress.
Fluid challenge. Rapid infusion of about 500 mL of saline (7 to 10 mL/kg) over 5 to 10 minutes, with a wedge pressure rising above 18 mm Hg, suggests heart failure with preserved ejection fraction (2022 ESC/ERS). The 7th WSPH task force describes the test in patients with precapillary pulmonary hypertension and a wedge pressure of 13 to 15 mm Hg, in whom a rise above 18 mm Hg may indicate left heart disease. In 212 patients referred for pulmonary hypertension, a saline challenge of 7 mL/kg raised wedge pressure by 7 ± 2 mm Hg in postcapillary disease and by 3 ± 1 mm Hg in precapillary disease and controls. It reclassified 8% of patients without pulmonary hypertension and 6% with precapillary disease as postcapillary, without adverse events, although the groups overlapped.
Exercise right heart catheterization. Invasive exercise, usually supine or semi-upright cycle ergometry with incremental workloads, is the reference test for exercise hemodynamics. Pressures and cardiac output are measured at each stage, averaged over the respiratory cycle, because respiratory swings increase during exercise even in healthy subjects. Direct Fick output is preferred during exercise, because thermodilution becomes more variable in rapid transitions. Exercise pulmonary hypertension is defined by a mean pulmonary artery pressure to cardiac output slope above 3 mm Hg/L/min between rest and exercise; the absolute mean pressure at peak exercise is not used, because it rises with age and workload. A wedge pressure to cardiac output slope above 2 mm Hg/L/min, or a peak supine wedge pressure of 25 mm Hg or more, points to a postcapillary cause.
In 55 euvolemic patients with exertional dyspnea, an ejection fraction above 50%, normal natriuretic peptide levels, and normal resting pressures, exercise wedge pressure of 25 mm Hg or more identified heart failure with preserved ejection fraction in 32. An exercise pulmonary artery systolic pressure of 45 mm Hg or more identified them with 96% sensitivity and 95% specificity. Diagnosis of heart failure with preserved ejection fraction is covered on the heart failure with preserved ejection fraction page.
| Test | Protocol | Abnormal response | Interpretation |
|---|---|---|---|
| Fluid challenge | 500 mL saline (7–10 mL/kg) over 5–10 min | Wedge >18 mm Hg | Occult left-sided filling pressure disease |
| Exercise, pulmonary vascular response | Incremental cycle ergometry with serial pressures and output | mPAP/CO slope >3 mm Hg/L/min | Exercise pulmonary hypertension |
| Exercise, left heart response | As above | PAWP/CO slope >2 mm Hg/L/min, or supine peak wedge ≥25 mm Hg | Postcapillary cause, typically HFpEF |
| Acute vasoreactivity | Inhaled nitric oxide 10–20 ppm | mPAP fall ≥10 mm Hg to <40 mm Hg, CO unchanged or increased | Candidate for calcium channel blockers (selected PAH) |
| Transplant vasodilator challenge | Nitroprusside or alternatives with SBP >85 mm Hg | Failure of PVR and TPG to fall | Fixed pulmonary hypertension; relative contraindication |
mPAP, mean pulmonary artery pressure; CO, cardiac output; PAWP, pulmonary artery wedge pressure; HFpEF, heart failure with preserved ejection fraction; SBP, systolic blood pressure.
Characteristic waveforms in pericardial, myocardial, valvular, and outflow tract disease
Simultaneous recording of right and left ventricular pressures with respiration, the dip-and-plateau contour, and dynamic respiratory discordance in constrictive pericarditis are covered on the constrictive pericarditis page.
Cardiac tamponade. Fluid under pressure compresses all chambers throughout the cardiac cycle. Right atrial, right ventricular diastolic, pulmonary artery diastolic, and wedge pressures rise and approach one another, typically within 5 mm Hg. Venous return to the right atrium is confined to ventricular systole, when the heart empties and intrapericardial pressure falls, so the x descent is preserved and the y descent is blunted or absent. The ventricular tracing shows no dip and plateau. Pulsus paradoxus, an inspiratory fall in systolic arterial pressure of more than 10 mm Hg, reflects ventricular interdependence. After pericardiocentesis, intrapericardial pressure falls toward zero and the right atrial pressure falls with it; a right atrial pressure that remains high with a new y descent indicates effusive-constrictive disease.
Restrictive cardiomyopathy. Stiff myocardium produces rapid early filling that stops abruptly, a dip and plateau in both ventricles, and a prominent y descent, as in constriction. Left ventricular filling pressure usually exceeds right by more than 5 mm Hg, pulmonary artery systolic pressure is often above 50 mm Hg, and right and left ventricular systolic pressures rise and fall together with respiration. Restriction is commonly accompanied by a large wedge v wave and secondary pulmonary hypertension.
Severe tricuspid regurgitation. The regurgitant jet fills the right atrium during systole. The x descent disappears, the c and v waves merge into a tall systolic wave, and as regurgitation becomes severe the right atrial tracing takes the shape of the right ventricular tracing, a pattern called ventricularization. Right atrial pressure rises with inspiration. Thermodilution output is unreliable in this setting.
Severe mitral regurgitation. The wedge tracing shows a large v wave that begins early in systole, merges with the c wave, and obliterates the x descent; the mean wedge pressure exceeds left ventricular end-diastolic pressure.
Mitral and tricuspid stenosis. The atrial tracing has a tall a wave and a slow, shallow y descent, and a diastolic gradient persists between atrium and ventricle throughout diastole. In atrial fibrillation the a wave disappears, and the gradient varies with each cycle length, so 5 to 10 beats are averaged.
Right ventricular infarction. Right atrial pressure is high relative to wedge pressure, and the right atrial tracing has prominent x and y descents in an M or W shape. When right atrial pressure is already high, further volume enlarges the right ventricle, shifts the septum, and lowers left ventricular filling.
Acute severe aortic regurgitation. Left ventricular diastolic pressure rises rapidly and can exceed left atrial pressure in late diastole, closing the mitral valve early and protecting the pulmonary veins. Aortic diastolic pressure falls toward left ventricular diastolic pressure, and the two may equalize at end-diastole.
Dynamic left ventricular outflow obstruction. After a premature ventricular contraction, the next beat has greater contractility. In fixed aortic stenosis, the post-extrasystolic beat ejects a larger stroke volume and the aortic pulse pressure widens. In obstructive hypertrophic cardiomyopathy, the increased contractility worsens the obstruction, so left ventricular systolic pressure rises while aortic pulse pressure falls or fails to rise (the Brockenbrough-Braunwald-Morrow sign). The aortic tracing has a spike-and-dome contour.
Echocardiographic estimates compared with invasive values
Echocardiography estimates the same variables noninvasively, and the agreement determines when catheterization is needed. Pulmonary artery systolic pressure is estimated as 4 × (peak tricuspid regurgitant velocity)² plus right atrial pressure, assuming no pulmonic or right ventricular outflow obstruction. The 2025 American Society of Echocardiography (ASE) right heart guideline reports right atrial pressure as a single value from inferior vena caval size and collapse: 3 mm Hg for a normal, collapsing cava, 15 mm Hg for a dilated cava that collapses less than 50% with a sniff, and 8 mm Hg when findings are indeterminate. The 2022 ESC/ERS guideline uses a peak tricuspid regurgitant velocity above 2.8 m/s as the threshold for echocardiographic suspicion of pulmonary hypertension.
Doppler estimates of systolic pulmonary pressure are unbiased on average but imprecise in individual patients: an incomplete or poorly aligned tricuspid regurgitant envelope underestimates pressure, and severe tricuspid regurgitation with a laminar jet invalidates the simplified Bernoulli equation. Caval estimates of right atrial pressure are unreliable during mechanical ventilation. Echocardiography establishes the probability of pulmonary hypertension; it does not measure mean pressure, wedge pressure, or PVR, and it cannot classify pulmonary hypertension. Right heart catheterization is required when the diagnosis or treatment depends on those values.
Sources of error in hemodynamic measurement
- Transducer level: a zero reference placed too low raises every pressure, and one placed too high lowers every pressure, by 0.74 mm Hg per centimeter. The morphology of the tracings remains normal, which hides the error.
- Damping: overdamping lowers systolic and raises diastolic pressure while the mean is preserved; underdamping produces overshoot. The fast-flush test identifies both before the study is interpreted.
- Respiratory phase: pressures read at end-inspiration underestimate, and in patients with obesity or obstructive lung disease end-expiratory values can overestimate, transmural pressure. Averaging over several cycles is used when swings are large.
- An invalid wedge: an underwedged tracing reports a hybrid of pulmonary artery and wedge pressure; an overwedged tracing rises without pulsation. A wedge saturation close to arterial saturation confirms a true wedge.
- Wedge pressure assumed to equal left ventricular end-diastolic pressure: mitral stenosis, large v waves, atrial fibrillation, and a stiff ventricle separate the two; discordance can reclassify pulmonary hypertension.
- Assumed oxygen consumption reported as measured: one in five estimates is in error by more than 25%, and the error passes into cardiac output and every resistance.
- Thermodilution in a shunt or severe tricuspid regurgitation: shunts invalidate it and regurgitation makes it unreliable in either direction.
- A missing factor of 10 in the Fick denominator: output is inflated tenfold.
- Indexed PVR calculated by dividing by body surface area: resistance is indexed by multiplying.
- Shunt calculations on supplemental oxygen: dissolved oxygen is ignored and PVR is lowered by the oxygen itself.
- Sedation, diuresis, and fasting before the study: resting pressures underestimate the patient's ambulatory hemodynamics and may require provocation.
- Peak-to-peak gradient compared with the Doppler peak instantaneous gradient: the two measure different quantities, and the mean gradient is the comparable value.
Self-assessment
A 46-year-old woman with exertional dyspnea and a dilated right ventricle has these saturations: superior vena cava 68%, inferior vena cava 76%, right atrium 82%, right ventricle 82%, pulmonary artery 81%, and aorta 97%. Mean pulmonary artery pressure is 24 mm Hg and wedge pressure 10 mm Hg. Where is the shunt, what is Qp/Qs, and why is a thermodilution cardiac output not used to calculate her pulmonary vascular resistance?
Cardiovascular Medicine Board ReviewReferences
- Heidenreich PA, Bozkurt B, Aguilar D, et al. 2022 AHA/ACC/HFSA guideline for the management of heart failure: a report of the American College of Cardiology/American Heart Association Joint Committee on Clinical Practice Guidelines. Circulation. 2022;145:e895–e1032. doi:10.1161/CIR.0000000000001063
- Kovacs G, Bartolome S, Denton CP, et al. Definition, classification and diagnosis of pulmonary hypertension. Eur Respir J. 2024;64:2401324. doi:10.1183/13993003.01324-2024
- Humbert M, Kovacs G, Hoeper MM, et al. 2022 ESC/ERS guidelines for the diagnosis and treatment of pulmonary hypertension. Eur Heart J. 2022;43:3618–3731. doi:10.1093/eurheartj/ehac237
- Sorajja P, Borlaug BA, Dimas VV, et al. SCAI/HFSA clinical expert consensus document on the use of invasive hemodynamics for the diagnosis and management of cardiovascular disease. Catheter Cardiovasc Interv. 2017;89:E233–E247. doi:10.1002/ccd.26888
- Belkin MN, Fudim M, Baratto C, et al. Standardization of baseline and provocative invasive hemodynamic protocols for the evaluation of heart failure and pulmonary hypertension: a scientific statement from the American Heart Association. Circ Heart Fail. 2026;19:e000088. doi:10.1161/HHF.0000000000000088
- Gurvitz M, Krieger EV, Fuller S, et al. 2025 ACC/AHA/HRS/ISACHD/SCAI guideline for the management of adults with congenital heart disease: a report of the American College of Cardiology/American Heart Association Joint Committee on Clinical Practice Guidelines. Circulation. 2026;153:e115–e251. doi:10.1161/CIR.0000000000001402
- Baumgartner H, De Backer J, Babu-Narayan SV, et al. 2020 ESC guidelines for the management of adult congenital heart disease. Eur Heart J. 2021;42:563–645. doi:10.1093/eurheartj/ehaa554
- Mehra MR, Canter CE, Hannan MM, et al. The 2016 International Society for Heart Lung Transplantation listing criteria for heart transplantation: a 10-year update. J Heart Lung Transplant. 2016;35:1–23. doi:10.1016/j.healun.2015.10.023
- Otto CM, Nishimura RA, Bonow RO, et al. 2020 ACC/AHA guideline for the management of patients with valvular heart disease: a report of the American College of Cardiology/American Heart Association Joint Committee on Clinical Practice Guidelines. Circulation. 2021;143:e72–e227. doi:10.1161/CIR.0000000000000923
- Swan HJ, Ganz W, Forrester J, et al. Catheterization of the heart in man with use of a flow-directed balloon-tipped catheter. N Engl J Med. 1970;283:447–451. doi:10.1056/NEJM197008272830902
- Forrester JS, Diamond G, Chatterjee K, Swan HJ. Medical therapy of acute myocardial infarction by application of hemodynamic subsets (first of two parts). N Engl J Med. 1976;295:1356–1362. doi:10.1056/NEJM197612092952406
- Binanay C, Califf RM, Hasselblad V, et al. Evaluation study of congestive heart failure and pulmonary artery catheterization effectiveness: the ESCAPE trial. JAMA. 2005;294:1625–1633. doi:10.1001/jama.294.13.1625
- Harvey S, Harrison DA, Singer M, et al. Assessment of the clinical effectiveness of pulmonary artery catheters in management of patients in intensive care (PAC-Man): a randomised controlled trial. Lancet. 2005;366:472–477. doi:10.1016/S0140-6736(05)67061-4
- Sandham JD, Hull RD, Brant RF, et al. A randomized, controlled trial of the use of pulmonary-artery catheters in high-risk surgical patients. N Engl J Med. 2003;348:5–14. doi:10.1056/NEJMoa021108
- Garan AR, Kanwar M, Thayer KL, et al. Complete hemodynamic profiling with pulmonary artery catheters in cardiogenic shock is associated with lower in-hospital mortality. JACC Heart Fail. 2020;8:903–913. doi:10.1016/j.jchf.2020.08.012
- Hoeper MM, Lee SH, Voswinckel R, et al. Complications of right heart catheterization procedures in patients with pulmonary hypertension in experienced centers. J Am Coll Cardiol. 2006;48:2546–2552. doi:10.1016/j.jacc.2006.07.061
- Bootsma IT, Boerma EC, de Lange F, Scheeren TWL. The contemporary pulmonary artery catheter. Part 1: placement and waveform analysis. J Clin Monit Comput. 2022;36:5–15. doi:10.1007/s10877-021-00662-8
- Bootsma IT, Boerma EC, Scheeren TWL, de Lange F. The contemporary pulmonary artery catheter. Part 2: measurements, limitations, and clinical applications. J Clin Monit Comput. 2022;36:17–31. doi:10.1007/s10877-021-00673-5
- Guglielmi G, Krishnathasan K, Constantine A, Dimopoulos K. Cardiac catheterization in pulmonary arterial hypertension: tips and tricks to enhance diagnosis and guide therapy. Int J Cardiol Congenit Heart Dis. 2024;17:100527. doi:10.1016/j.ijcchd.2024.100527
- Nishimura RA, Carabello BA. Hemodynamics in the cardiac catheterization laboratory of the 21st century. Circulation. 2012;125:2138–2150. doi:10.1161/CIRCULATIONAHA.111.060319
- Kovacs G, Berghold A, Scheidl S, Olschewski H. Pulmonary arterial pressure during rest and exercise in healthy subjects: a systematic review. Eur Respir J. 2009;34:888–894. doi:10.1183/09031936.00145608
- Opotowsky AR, Hess E, Maron BA, et al. Thermodilution vs estimated Fick cardiac output measurement in clinical practice: an analysis of mortality from the Veterans Affairs Clinical Assessment, Reporting, and Tracking (VA CART) program and Vanderbilt University. JAMA Cardiol. 2017;2:1090–1099. doi:10.1001/jamacardio.2017.2945
- Narang N, Gore MO, Snell PG, et al. Accuracy of estimating resting oxygen uptake and implications for hemodynamic assessment. Am J Cardiol. 2012;109:594–598. doi:10.1016/j.amjcard.2011.10.010
- Hemnes AR, Opotowsky AR, Assad TR, et al. Features associated with discordance between pulmonary arterial wedge pressure and left ventricular end diastolic pressure in clinical practice: implications for pulmonary hypertension classification. Chest. 2018;154:1099–1107. doi:10.1016/j.chest.2018.08.1033
- Fuchs RM, Heuser RR, Yin FC, Brinker JA. Limitations of pulmonary wedge V waves in diagnosing mitral regurgitation. Am J Cardiol. 1982;49:849–854. doi:10.1016/0002-9149(82)91968-3
- Antman EM, Marsh JD, Green LH, Grossman W. Blood oxygen measurements in the assessment of intracardiac left to right shunts: a critical appraisal of methodology. Am J Cardiol. 1980;46:265–271. doi:10.1016/0002-9149(80)90068-5
- Gorlin R, Gorlin SG. Hydraulic formula for calculation of the area of the stenotic mitral valve, other cardiac valves, and central circulatory shunts. I. Am Heart J. 1951;41:1–29. doi:10.1016/0002-8703(51)90002-6
- Hakki AH, Iskandrian AS, Bemis CE, et al. A simplified valve formula for the calculation of stenotic cardiac valve areas. Circulation. 1981;63:1050–1055. doi:10.1161/01.cir.63.5.1050
- Sitbon O, Humbert M, Jaïs X, et al. Long-term response to calcium channel blockers in idiopathic pulmonary arterial hypertension. Circulation. 2005;111:3105–3111. doi:10.1161/CIRCULATIONAHA.104.488486
- D'Alto M, Romeo E, Argiento P, et al. Clinical relevance of fluid challenge in patients evaluated for pulmonary hypertension. Chest. 2017;151:119–126. doi:10.1016/j.chest.2016.08.1439
- Borlaug BA, Nishimura RA, Sorajja P, et al. Exercise hemodynamics enhance diagnosis of early heart failure with preserved ejection fraction. Circ Heart Fail. 2010;3:588–595. doi:10.1161/CIRCHEARTFAILURE.109.930701
- Maron BA, Bortman G, De Marco T, et al. Pulmonary hypertension associated with left heart disease. Eur Respir J. 2024;64:2401344. doi:10.1183/13993003.01344-2024
- Korabathina R, Heffernan KS, Paruchuri V, et al. The pulmonary artery pulsatility index identifies severe right ventricular dysfunction in acute inferior myocardial infarction. Catheter Cardiovasc Interv. 2012;80:593–600. doi:10.1002/ccd.23309
- Kang G, Ha R, Banerjee D. Pulmonary artery pulsatility index predicts right ventricular failure after left ventricular assist device implantation. J Heart Lung Transplant. 2016;35:67–73. doi:10.1016/j.healun.2015.06.009
- Kormos RL, Teuteberg JJ, Pagani FD, et al. Right ventricular failure in patients with the HeartMate II continuous-flow left ventricular assist device: incidence, risk factors, and effect on outcomes. J Thorac Cardiovasc Surg. 2010;139:1316–1324. doi:10.1016/j.jtcvs.2009.11.020
- Fincke R, Hochman JS, Lowe AM, et al. Cardiac power is the strongest hemodynamic correlate of mortality in cardiogenic shock: a report from the SHOCK trial registry. J Am Coll Cardiol. 2004;44:340–348. doi:10.1016/j.jacc.2004.03.060
- Mukherjee M, Rudski LG, Addetia K, et al. Guidelines for the echocardiographic assessment of the right heart in adults and special considerations in pulmonary hypertension: recommendations from the American Society of Echocardiography. J Am Soc Echocardiogr. 2025;38:141–186. doi:10.1016/j.echo.2025.01.006
- Gerhardt F, Fiessler E, Olsson KM, et al. Positive vasoreactivity testing in pulmonary arterial hypertension: therapeutic consequences, treatment patterns, and outcomes in the modern management era. Circulation. 2024;149:1549–1564. doi:10.1161/CIRCULATIONAHA.122.063821