Library › Imaging › Nuclear perfusion imaging
Myocardial perfusion imaging with SPECT and PET
Nuclear stress perfusion imaging in adults from tracers, stressors, and SPECT and PET protocols through scoring, absolute blood flow, artifacts, high-risk findings, viability, and reporting.
Myocardial perfusion imaging records the distribution of a flow tracer injected at peak stress and at rest. A defect present at stress and absent at rest is ischemia; a defect present on both is scar or artifact. Ischemia involving 10% or more of the left ventricle is a high-risk finding, a summed difference score of 7 or more on the 17-segment model. Positron emission tomography (PET) adds absolute myocardial blood flow: a global flow reserve below 1.5 is high risk, and stress flow and reserve above 2.0 make left main or three-vessel disease unlikely.
How perfusion tracers measure flow and coronary flow reserve
Resting myocardial blood flow is about 0.4 to 1.2 mL/min/g and is held constant by arteriolar autoregulation across a wide range of epicardial stenosis. A territory supplied by a flow-limiting stenosis maintains resting flow by dilating its distal arterioles, which spends the reserve that would otherwise be available on demand. At rest, a tracer bolus therefore distributes almost evenly between a stenotic and a normal territory. Under exercise or vasodilator stress, flow in the normal territory rises three- to fourfold while the stenotic territory adds little, and the tracer distributes unequally. The image records that relative difference. Stress perfusion abnormalities generally appear at diameter stenoses of about 50% or more, whereas resting flow falls only with very severe stenosis.
The detected myocardial signal is the product of delivery (flow × arterial tracer concentration), extraction, retention, physical decay, and detection efficiency. First-pass extraction fraction is E = (Ca − Cv) ÷ Ca, the fraction of tracer presented to the capillary bed that enters tissue on a single pass. For every tracer except O-15 water, extraction falls as flow rises, because capillary transit shortens. This roll-off compresses hyperemic flow differences. A normal territory at 3.0 mL/min/g and a stenotic territory at 2.0 mL/min/g differ by a flow ratio of 1.5, but the ratio of retained activity is smaller because extraction is higher in the slower territory. Roll-off is most pronounced for Rb-82 and the technetium agents, less for N-13 ammonia, and least for F-18 flurpiridaz. A tracer with a flatter extraction curve separates mild from severe stenoses more completely and supports absolute flow measurement.
Retention requires a living cell. Technetium-99m sestamibi and tetrofosmin are lipophilic cations retained by the negative potential of the inner mitochondrial membrane; thallium-201 and Rb-82 are potassium analogues taken up by the sodium-potassium ATPase; N-13 ammonia is trapped as glutamine by glutamine synthetase; and flurpiridaz binds mitochondrial complex I. Scar shows reduced counts for two reasons: flow is reduced, and necrotic tissue cannot hold the tracer.
The ischemic cascade begins with perfusion heterogeneity and proceeds through metabolic change, diastolic dysfunction, regional systolic dysfunction, electrocardiographic change, and angina. Perfusion imaging detects the first step of that sequence, which is why a perfusion defect can appear with normal wall motion and without symptoms or ST depression.
SPECT and PET perfusion tracers
Single-photon emission computed tomography (SPECT) detects single gamma photons through a lead collimator that admits only photons travelling within a narrow angle, so most emitted photons are discarded and the image is count-limited. Positron emission tomography (PET) detects the pair of 511-keV photons produced when a positron annihilates; detection of both photons within a timing window localizes the event along a line without a collimator. PET therefore has higher count sensitivity, better spatial resolution, and attenuation correction as an integral part of reconstruction, and its dynamic acquisition supports measurement of flow in mL/min/g.
| Tracer | Half-life and production | Uptake and retention | Extraction at high flow | Practical features |
|---|---|---|---|---|
| Tc-99m sestamibi | 6 h; Mo-99/Tc-99m generator and kit | Passive diffusion; mitochondrial retention; minimal redistribution | Moderate, with roll-off | 140-keV photon; hepatobiliary clearance; separate stress and rest injections |
| Tc-99m tetrofosmin | 6 h; generator and kit | As sestamibi | Moderate, with roll-off | Faster liver clearance permits earlier imaging |
| Thallium-201 | 73 h; cyclotron | Na⁺/K⁺ ATPase; redistributes over hours | High initial extraction | 69–83 keV x-rays with more attenuation; highest radiation dose; used for viability by redistribution and reinjection |
| Rubidium-82 | 75 s; Sr-82/Rb-82 generator on site | Na⁺/K⁺ ATPase | Most pronounced roll-off | Largest positron range; rest and stress within about 30 minutes; pharmacologic stress only |
| N-13 ammonia | 10 min; on-site cyclotron | Metabolic trapping as glutamine | High | Excellent image quality; lung uptake in heart failure and smokers |
| F-18 flurpiridaz | 110 min; regional cyclotron, unit-dose delivery | Binds mitochondrial complex I | Highest of the retained tracers | FDA approved in 2024 for rest and pharmacologic or exercise stress PET; short positron range |
| O-15 water | 2 min; on-site cyclotron | Freely diffusible; not retained | Near complete and flow independent | Reference method for flow; parametric images only; not a routine commercial agent in the United States |
Properties from the American Society of Nuclear Cardiology (ASNC) SPECT and PET guidelines, the flurpiridaz prescribing information, and the joint flurpiridaz procedure standard.
Rb-82 is eluted from a strontium generator and infused within seconds, so stress must be pharmacologic: the tracer cannot be carried from a treadmill to the scanner. Its 75-second half-life gives a low radiation dose and fast throughput but a narrow imaging window, and its long positron range blurs images more than F-18. N-13 ammonia is used mainly in academic centers. Flurpiridaz has a half-life long enough for regional distribution and is the first PET perfusion tracer approved in the United States for treadmill exercise stress: the dose is injected at peak exercise, the patient continues to walk for 1 to 2 minutes, and imaging begins 15 to 25 minutes later. In two phase 3 trials, flurpiridaz PET had higher sensitivity than SPECT for angiographic stenosis of 50% or more, with similar specificity in the first trial.
FDG (F-18 fluorodeoxyglucose) is not a perfusion tracer. It is transported by GLUT transporters and phosphorylated by hexokinase, and it maps glucose metabolism for viability and, with a suppression diet, for inflammation. Technetium pyrophosphate and other bone-avid tracers for transthyretin amyloidosis are covered under cardiac amyloidosis.
Patient preparation for stress perfusion imaging
Patients fast for at least 3 to 4 hours, except for water and medications. Caffeine and other methylxanthines are competitive adenosine receptor antagonists, and they blunt the hyperemia produced by adenosine, regadenoson, and dipyridamole. The regadenoson label requires abstinence from caffeinated beverages, caffeine-containing drug products, aminophylline, and theophylline for at least 12 hours before vasodilator stress. The 2026 ASNC stress guideline extends abstinence to decaffeinated coffee, tea, and soda, which contain small amounts of caffeine, and to chocolate; it requires at least 12 hours and recommends 24 hours. Oral dipyridamole is withheld for at least 48 hours before adenosine or regadenoson, because it raises endogenous adenosine and potentiates the response. Patients scheduled for exercise receive the same instruction when conversion to vasodilator stress is possible.
Beta-blockers, nondihydropyridine calcium channel blockers, and nitrates reduce the sensitivity of exercise perfusion imaging by limiting the heart rate and the ischemic stimulus. The decision is individualized: these drugs are more commonly withheld for an initial diagnostic evaluation of suspected coronary disease, with the duration set by the drug, the indication, and the risk of withdrawal, and they are continued when the purpose is to judge ischemia on therapy, which the report states. Antianginal drugs are usually continued for vasodilator stress. Proton pump inhibitors increase gastric wall activity adjacent to the inferior wall on technetium SPECT and Rb-82 PET.
Women of childbearing potential are screened for pregnancy before any radiopharmaceutical is injected. Lactating patients receive tracer-specific instructions, set out under special populations.
Exercise stress: protocol, adequacy, and treadmill findings
Exercise is the preferred stressor whenever the patient can exercise adequately and the electrocardiogram is interpretable, because it supplies functional capacity, symptoms, heart-rate and blood-pressure response, and ST changes that pharmacologic stress cannot. Functional capacity is among the strongest predictors of mortality in patients referred for testing, independent of perfusion.
The Bruce protocol begins at 1.7 mph and 10% grade and raises speed and grade every 3 minutes (stage 2: 2.5 mph, 12%; stage 3: 3.4 mph, 14%; stage 4: 4.2 mph, 16%). Completing stage 1 corresponds to about 4 to 5 metabolic equivalents (METs) and stage 3 to about 10 METs. Modified Bruce and Naughton protocols add low-workload stages for older or deconditioned patients; the target is 6 to 12 minutes of progressive exercise. Exercise is symptom limited. Reaching 85% of age-predicted maximal heart rate (220 − age) is the conventional benchmark of an adequate chronotropic response, not a reason to stop. The tracer is injected at peak exercise, and exercise continues for about 1 minute afterward so that tracer extraction occurs under stress conditions.
Standard reasons to terminate exercise are moderate to severe angina; increasing neurologic symptoms, ataxia, or signs of poor perfusion; a fall in systolic blood pressure of more than 10 mm Hg below baseline with other evidence of ischemia; ST elevation of 1 mm or more in leads without Q waves (other than V1 or aVR); sustained ventricular tachycardia; marked ST depression; a hypertensive response above about 250/115 mm Hg; inability to monitor the electrocardiogram or blood pressure; and the patient's request.
Exercise electrocardiographic findings add to the perfusion result. Horizontal or downsloping ST depression of 1 mm or more 80 ms after the J point is the standard positive response; ST depression of 2 mm or more at low workload or persisting into recovery, exercise-induced ST elevation, exercise hypotension, and sustained ventricular arrhythmia are high-risk findings even when perfusion appears normal. The Duke treadmill score (exercise minutes − 5 × ST deviation in mm − 4 × angina index) is calculated on the chronic coronary disease page. A submaximal test, injected below the expected heart rate or after early termination for leg fatigue, lowers sensitivity; when the patient cannot reach an adequate workload, the protocol converts to a vasodilator.
Vasodilator stress: adenosine, regadenoson, and dipyridamole
Vasodilators produce hyperemia without a large rise in oxygen demand. Activation of the A2A adenosine receptor on coronary arteriolar smooth muscle raises cyclic AMP and increases flow three- to fivefold in normal territories, while flow through a stenosis rises much less. The defect therefore reflects heterogeneity of flow; true ischemia (supply below demand) occurs mainly with collateral steal or severe disease, which is why vasodilator studies show ST depression less often than exercise. Adenosine activates all four receptor subtypes: A1 activation slows sinoatrial and atrioventricular nodal conduction, A2B and A3 activation contribute to bronchospasm, and A2B activation adds peripheral vasodilation and flushing. Regadenoson is a selective, high-affinity A2A agonist given as a fixed bolus. Dipyridamole blocks cellular reuptake and breakdown of endogenous adenosine, so its effect builds after the infusion and lasts longer.
| Agent | Dose | Tracer injection | Common effects | Reversal |
|---|---|---|---|---|
| Adenosine | 140 µg/kg/min for 6 minutes (0.84 mg/kg); a 4-minute infusion is an accepted alternative | At the midpoint (3 minutes) of the 6-minute infusion, which continues for the remaining 3 minutes | Flushing, chest pressure, dyspnea, headache; transient AV block in a minority | Stop the infusion (half-life under 10 seconds); aminophylline for persistent effects |
| Regadenoson | 0.4 mg IV bolus over about 10 seconds, then 5-mL saline flush; no weight adjustment | 10 to 20 seconds after the saline flush (SPECT); Rb-82 infusion timed to arrive at peak hyperemia | Dyspnea, headache, flushing, chest discomfort; modest rise in heart rate | Aminophylline 50 to 250 mg by slow IV injection |
| Dipyridamole | 0.142 mg/kg/min for 4 minutes (0.56 mg/kg) | 3 to 5 minutes after the infusion ends | As adenosine, more prolonged | Aminophylline, needed more often |
| Dobutamine | 5 or 10 µg/kg/min, increased every 3 minutes to 40 µg/kg/min; atropine if the target rate is not reached | At 85% of age-predicted maximal heart rate; infusion continues 1 to 2 minutes | Palpitations, ventricular ectopy, atrial fibrillation, hypertension or hypotension | Stop the infusion; short-acting IV beta-blocker |
Doses from current US prescribing information and the ASNC SPECT stress guideline. AV, atrioventricular; IV, intravenous.
Aminophylline, a methylxanthine, reverses all three vasodilators because it competes at the adenosine receptor. When the patient is stable, reversal is delayed until at least 1 minute after tracer injection, because reversal during first-pass extraction converts the study to near-resting conditions and removes its ability to exclude ischemia. Regadenoson can lower the seizure threshold, and seizures, some prolonged, have occurred. Methylxanthines are not given after a regadenoson seizure because they lower the threshold further. Intravenous benzodiazepine is the treatment, and intravenous caffeine is used when the vasodilator effect also needs reversal. Regadenoson can also cause atrial fibrillation, clinically significant hypotension (more likely with autonomic dysfunction, stenotic valve disease, pericardial disease, carotid stenosis, or hypovolemia), and clinically significant hypertension. In the ADVANCE phase 3 program, regadenoson images agreed with adenosine images as closely as two adenosine studies agreed with each other, with better tolerability.
A study acquired after recent caffeine, through an interrupted infusion, or with premature reversal is nondiagnostic despite flawless acquisition. On PET, a global flow reserve of about 1 with homogeneous relative perfusion identifies this vasodilator nonresponse.
Low-level exercise combined with vasodilator stress
Adding low-level treadmill exercise to adenosine or regadenoson, commonly walking at about 1.7 mph with 0% to 5% grade, combines vasodilator hyperemia with a modest rise in heart rate and sympathetic tone. Exercise redirects cardiac output toward skeletal muscle and constricts the splanchnic bed that vasodilators otherwise dilate, so hepatic and bowel activity beneath the inferior wall falls and the heart-to-background ratio rises. Flushing, headache, hypotension, and atrioventricular block are less frequent. In the randomized RegEx pilot, regadenoson given during low-level exercise produced fewer adverse effects than supine adenosine (77% versus 95%), no second-degree or higher atrioventricular block, and higher heart-to-liver ratios (0.85 versus 0.65).
The combination is avoided in left bundle branch block, ventricular pacing, and pre-excitation, because the heart-rate rise reintroduces the rate-dependent septal defect that the vasodilator was chosen to avoid. It is also unsuitable when the patient cannot walk safely, and the regadenoson label notes that clinically significant hypertension has been reported particularly in patients with underlying hypertension and when low-level exercise is included. A patient who attempts symptom-limited exercise and fails to reach an adequate heart rate can be converted to regadenoson while still walking, which preserves the exercise data and improves image quality.
Dobutamine stress
Dobutamine is a beta-1 agonist that raises heart rate, contractility, and blood pressure, increasing myocardial oxygen demand as exercise does. It is the pharmacologic stressor for patients who cannot exercise and cannot receive a vasodilator: active bronchospasm, high-grade atrioventricular block or sinus node dysfunction without a pacemaker, recent methylxanthine intake, or hypotension. The infusion starts at 5 or 10 µg/kg/min and increases every 3 minutes through 20, 30, and 40 µg/kg/min. Atropine in divided intravenous doses is added when the target rate is not reached, most often in patients taking beta-blockers. The tracer is injected at 85% of age-predicted maximal heart rate or at an ischemic endpoint, and the infusion continues for 1 to 2 minutes. Beta-blockers attenuate the response, and a short-acting intravenous beta-blocker reverses persistent ischemia or tachyarrhythmia.
Contraindications and choice of stressor
| Condition | Exercise | Adenosine or dipyridamole | Regadenoson | Dobutamine |
|---|---|---|---|---|
| Acute coronary syndrome not yet stabilized, or ongoing ischemic symptoms | Defer | Defer | Defer | Defer |
| Active bronchospasm or wheezing | Suitable if able | Contraindicated | Avoid on the day of wheeze; stable COPD or asthma tolerated with monitoring | Suitable |
| Second- or third-degree AV block or sinus node dysfunction without a pacemaker | Suitable | Contraindicated | Contraindicated | Suitable |
| Systolic blood pressure <90 mm Hg | Avoid | Avoid | Avoid | Caution |
| Uncontrolled hypertension (>200/110 mm Hg) | Avoid | Caution | Caution | Avoid |
| Methylxanthine within 12 hours | Suitable | Defer | Defer | Suitable |
| Seizure disorder with active seizures within the last 6 months | Suitable | Contraindicated (adenosine); caution (dipyridamole) | Contraindicated | Suitable |
| Left bundle branch block, ventricular pacing, or pre-excitation | Avoid (septal artifact) | Preferred | Preferred | Avoid (septal artifact) |
| Significant ventricular arrhythmia or uncontrolled atrial fibrillation | Caution | Monitor | Monitor | Avoid |
| Severe outflow obstruction or obstructive hypertrophic cardiomyopathy | Caution | Caution | Caution | Avoid |
| Symptomatic severe aortic stenosis | Contraindicated | Individual risk decision | Individual risk decision | Avoid |
| Acute aortic dissection, symptomatic or large aneurysm | Avoid | Contraindicated if symptomatic | Contraindicated if symptomatic | Avoid |
| Inability to reach an adequate workload | Not diagnostic | Preferred | Preferred | Alternative |
Synthesized from the adenosine and regadenoson prescribing information and ASNC stress guidance (2016, updated in the 2026 ASNC stress testing guideline). AV, atrioventricular; COPD, chronic obstructive pulmonary disease.
Decompensated heart failure, active endocarditis, acute myocarditis or pericarditis, acute pulmonary embolism, and severe anemia (hemoglobin below about 7 g/dL or active bleeding) defer stress testing of any kind. The regadenoson bolus requires no infusion pump or weight-based calculation, has smaller A1 effects, and is better tolerated than adenosine in stable airway disease without active wheeze. The short half-life of adenosine allows its effects to be ended within seconds by stopping the infusion.
SPECT protocols: one-day, two-day, stress-first, and dual-isotope
Technetium agents do not redistribute, so stress and rest require separate injections. Because Tc-99m has a 6-hour half-life, 71% of the first dose remains 3 hours later, and the second injection on the same day must carry about three times the activity of the first so that its distribution dominates the second acquisition.
| Protocol | Sequence and activity | Selected for | Limitation |
|---|---|---|---|
| One-day rest-stress | Rest 8–12 mCi, stress 24–36 mCi after 30 to 60 minutes | Known infarction; rest abnormality expected | Residual rest activity can make a stress defect look milder (shine-through) |
| One-day stress-first | Stress at low activity; rest acquired only if stress is abnormal or equivocal | Low to intermediate risk; no prior infarction | Lower count density at stress |
| Stress-only | Normal, technically adequate stress study ends the examination | Normal stress perfusion and function, ideally with attenuation correction | Requires validated laboratory criteria |
| Two-day | Full activity (up to about 30 mCi) on each of two days | Body mass index above about 35 to 40 kg/m²; large breasts; prior equivocal study | Two visits |
| Dual-isotope | Tl-201 rest, Tc-99m stress | No longer recommended for routine use | Highest dose; energy-window crosstalk; mismatched image quality |
| Thallium stress-redistribution-reinjection | Stress 2.5–3.5 mCi; redistribution at 3 to 4 hours; reinjection 1 to 2 mCi | Viability when PET is unavailable | High dose; lower-energy photons |
Typical activities for conventional Anger cameras from the ASNC SPECT stress and protocols guideline; activities on solid-state cameras are lower and are set by local validation.
The stress-first strategy avoids the rest injection in most patients without known coronary disease. In 16,854 consecutive patients with a normal gated stress SPECT, all-cause mortality after a normal stress-only study was no higher than after a normal stress-rest study, and the stress-only group received 61% less radiopharmaceutical activity. A stress-only result requires adequate stress, adequate count density, absence of motion and attenuation ambiguity, normal perfusion in every territory, and normal gated function; attenuation correction or prone imaging raises the proportion of studies that can stop after stress. A reduced ejection fraction, a regional wall motion abnormality, transient ischemic dilation, or any perfusion abnormality leads to rest imaging.
SPECT cameras, attenuation correction, and positional imaging
The conventional dual-head Anger camera uses sodium iodide crystals and photomultiplier tubes; a typical acquisition takes 12 to 20 minutes per study with reconstructed spatial resolution of about 10 to 15 mm. Dedicated cardiac cameras with cadmium zinc telluride (CZT) solid-state detectors and multipinhole or focused collimation convert photons directly to electrical signals and have several-fold higher count sensitivity and better energy resolution. They allow acquisition in a few minutes or a reduction in administered activity, and a stress-only CZT study can be performed with about 1 mSv. Patient position differs between systems (upright, semi-reclining, or supine), and normal databases are camera specific.
ECG gating divides each cardiac cycle into 8 or 16 frames and sums counts across thousands of beats to build one composite cycle. Gating adds ejection fraction, volumes, wall motion, and wall thickening without additional dose; it is routine for every SPECT and PET perfusion study.
Attenuation of 140-keV photons by soft tissue is the main source of false-positive SPECT defects. Attenuation correction applies a transmission map, now usually a low-dose CT, to reverse photon loss during reconstruction. It reduces inferior diaphragmatic and anterior breast artifacts and improves specificity, but a map that is misregistered with the emission data, truncated in a large patient, or distorted by contrast creates new defects. Corrected and uncorrected images are therefore read together, with the fused registration displayed. Prone imaging is an alternative that moves the diaphragm and abdominal contents away from the inferior wall; an inferior defect that resolves prone supports attenuation, and prone imaging can create an anterior defect of its own.
Radiation dose of perfusion protocols
Effective dose depends on administered activity, tracer biokinetics, camera sensitivity, patient size, and whether the CT is used only for attenuation correction. The CT component is reported separately; a low-dose attenuation map commonly adds less than 1 mSv, a gated calcium scan more, and CT angiography more again.
| Protocol | Approximate effective dose |
|---|---|
| Rb-82 PET, rest and stress | 1 to 4 mSv (1.1 to 3.5 mSv at up to 60 mCi per injection) |
| N-13 ammonia PET, 20 mCi per injection | About 1.5 to 2 mSv per injection |
| F-18 flurpiridaz PET, rest and pharmacologic stress (one day) | About 6.7 mSv (2.1 + 4.6 mSv at maximal labeled activity) |
| F-18 flurpiridaz PET, rest and exercise stress (one day) | About 7.4 mSv (2.1 + 5.3 mSv) |
| Tc-99m stress-only, solid-state camera | About 1 to 2 mSv |
| Tc-99m one-day, low activity (4–6 and 12–18 mCi) | About 4 to 6 mSv |
| Tc-99m one-day, conventional activity (8–12 and 24–36 mCi) | About 8 to 13 mSv |
| Thallium-201 protocols and dual-isotope | About 11 to 24 mSv (stress-redistribution 11 to 15 mSv; with reinjection 15 to 24 mSv; dual-isotope 13 to 23 mSv) |
Rb-82 and N-13 ammonia from the 2016 ASNC/SNMMI PET guideline; flurpiridaz from the US prescribing information; technetium and thallium values are representative protocol estimates from ASNC radiation guidance. Values exclude the CT component.
The ASNC set a goal of an effective dose of 9 mSv or less in at least half of perfusion studies. In the 65-country INCAPS survey of 7,911 studies in 2013, the median patient dose was 10.0 mSv, and only 30% of laboratories met a median of 9 mSv or less; laboratories that followed more of eight predefined radiation best practices delivered lower doses. Dose-reduction practices include avoidance of thallium and dual-isotope protocols, weight-based activity, stress-first and stress-only imaging, camera technology that allows lower activity, PET where available, and avoidance of inappropriate testing.
PET perfusion protocols
Rb-82 and N-13 ammonia studies are performed with vasodilator stress on the scanner. A rest acquisition (dynamic list-mode for flow, gated, with a low-dose CT for attenuation correction) is followed by a stress acquisition with a second injection timed to peak hyperemia. With regadenoson and Rb-82, the generator infusion is started so that tracer reaches the heart near maximal hyperemia, and each laboratory measures its own delivery delay. The whole Rb-82 rest-stress study takes about 30 to 45 minutes. Gated PET images are acquired during peak vasodilator stress, whereas SPECT gated images are acquired 15 to 45 minutes after stress; PET therefore measures peak-stress function, and the expected rise in ejection fraction with vasodilator stress makes its failure informative.
Flurpiridaz allows one-day rest-stress or two-day studies. On one day, rest uses 2.5 to 3 mCi and stress uses 6 to 6.5 mCi for pharmacologic stress or 9 to 9.5 mCi for exercise, with at least 30 minutes between injections for pharmacologic stress and 60 minutes for exercise; on two days each injection is 2.5 to 3 mCi. Rest and pharmacologic stress acquisitions begin 5 minutes after injection and last 10 minutes, and dynamic acquisition for flow starts immediately before injection. Exercise images start 15 to 25 minutes after injection, and because the first pass occurs outside the scanner, an exercise injection yields no absolute flow.
The 2021 AHA/ACC chest pain guideline rates PET as reasonable in preference to SPECT, when available, for intermediate- to high-risk patients with stable chest pain selected for nuclear perfusion imaging (Class 2a). In patients with obstructive coronary disease and stable chest pain despite guideline-directed therapy, it rates the addition of myocardial blood flow reserve to stress PET or CMR as reasonable to improve diagnostic accuracy and risk stratification (Class 2a). In patients with known chronic coronary disease and persistent symptoms despite guideline-directed therapy, the 2023 AHA/ACC guideline recommends stress PET or SPECT, cardiovascular magnetic resonance (CMR), or echocardiography to detect and quantify ischemia (Class 1). The 2016 ASNC and Society of Nuclear Medicine and Molecular Imaging (SNMMI) indications statement made PET the preferred test for patients who need stress imaging but cannot exercise. It also named PET as preferred after poor-quality or equivocal prior studies, with body habitus that degrades image quality, in younger and higher-risk patients, and when flow quantification is needed. The 2026 ASNC position statement extends this: where available, PET with flow quantification is recommended for all patients with suspected coronary disease who are candidates for perfusion imaging.
PET remains less available than SPECT, the most widely available and most extensively validated perfusion test. Rb-82 requires an on-site generator replaced every 6 to 8 weeks according to the generator system, which is economical only at sufficient patient volume, and N-13 ammonia requires an on-site cyclotron; unit-dose F-18 flurpiridaz removes both requirements and makes PET feasible in laboratories with a PET/CT scanner but no generator.
Myocardial blood flow quantification with PET
Dynamic acquisition starts with the tracer bolus and records the arterial input function from a region in the left ventricular cavity or left atrium, and myocardial time-activity curves from each territory. A kinetic model (most often a one-tissue compartment model) yields the uptake rate constant K1, which a tracer-specific extraction function converts to flow in mL/min/g. Myocardial flow reserve (MFR) is stress flow divided by rest flow.
| Measurement | Value | Interpretation |
|---|---|---|
| Rest flow, healthy volunteers | Rb-82 about 0.74 mL/min/g; N-13 ammonia about 0.71 mL/min/g | Clinical rest flow generally 0.4 to 1.2 mL/min/g; rises with rate-pressure product, anxiety, and nicotine |
| Stress flow, healthy volunteers | Rb-82 about 2.9 mL/min/g; N-13 ammonia about 2.6 mL/min/g | Lower in older clinical populations |
| Global MFR >2.5 | >2.5 | High-risk angiographic disease extremely uncommon when no regional value is lower |
| Global stress flow >2.0 mL/min/g and MFR >2.0 | >2.0 and >2.0 | Left main or three-vessel disease unlikely; negative predictive value above 95% |
| Global MFR <2.0 | <2.0 | Cardiac mortality rises continuously as reserve falls |
| Global MFR <1.5 | <1.5 | High-risk feature; lowest tertile in the derivation cohort had a 5.6-fold higher risk of cardiac death |
| Regional stress flow <1.5 mL/min/g or regional MFR <1.5 | <1.5 | Flow-limiting epicardial disease in that territory, especially with normal relative perfusion |
| Global MFR about 1 with normal relative perfusion | ≈1 | Vasodilator nonresponse (caffeine, infusion failure) until proven otherwise |
Thresholds from the SNMMI/ASNC joint position paper on clinical flow quantification (2018) and the 2016 ASNC/SNMMI PET guideline, validated mainly with Rb-82 and N-13 ammonia. Values vary with tracer, kinetic model, and software, and are guides; O-15 water gives higher hyperemic values and has its own thresholds.
Flow reserve is a ratio, so it falls when stress flow falls or when rest flow rises. A high resting flow from hypertension, tachycardia, anemia, or anxiety lowers reserve with a normal hyperemic response; a low resting flow over a large infarct preserves reserve despite poor hyperemic capacity. Both absolute values are reported with the ratio. A globally reduced reserve does not identify its cause. Left main or multivessel obstruction, diffuse nonobstructive atherosclerosis, and coronary microvascular dysfunction produce the same global value, and the relative images, the regional pattern, visible coronary calcium, and the clinical setting separate them. In a single-center registry of 12,594 patients undergoing Rb-82 PET, every 0.1 decrease in reserve was associated with a 9% higher hazard of death. Patients with reserve of 1.8 or less had better survival with early revascularization than with medical therapy irrespective of the amount of ischemia. That observational interaction has not been tested in a randomized trial.
A flow value is accepted only after technical review, because the kinetic model returns a number from any curve. The review covers complete bolus delivery without infiltration, an untruncated first-pass peak free of detector saturation, absence of motion during the dynamic frames, placement of the blood-pool region, the shape of the blood-pool and tissue curves, the model fit, registration of each emission scan with its attenuation map, and stress adequacy. When the review fails, the report states that flow could not be quantified and why.
Dynamic SPECT flow quantification
High-sensitivity CZT cameras can acquire dynamic first-pass data with Tc-99m sestamibi or tetrofosmin and estimate myocardial blood flow and reserve, using a net-retention or compartment model with an extraction correction for the technetium agent. In the WATERDAY study of 30 patients, dynamic sestamibi CZT SPECT gave higher absolute stress and rest flow than O-15 water PET in some territories but similar flow reserve. With an ischemic threshold of 2.1, it had a sensitivity of 83% and a specificity of 96% for abnormal PET flow reserve, and a specificity of 85% for fractional flow reserve of 0.80 or less. The 2018 ASNC SPECT guideline treats SPECT flow quantification as an emerging technique. It requires a bolus injection with a fixed rate, a camera that does not saturate during the first pass, motion control, attenuation and scatter correction, and system-specific normal values. PET thresholds are not transferred to dynamic SPECT without local validation, and the technique is not yet a substitute for PET flow measurement.
Display and orientation of perfusion images
Reconstructed images are reoriented along the long axis of the left ventricle and displayed in three standard planes: short-axis slices from apex to base, vertical long-axis slices from septum to lateral wall, and horizontal long-axis slices from inferior to anterior wall. Stress slices are displayed above the matching rest slices, normalized to the brightest myocardial region of each study, with a constant color scale. The polar map (bull's-eye) projects the three-dimensional ventricle onto a plane, with the apex at the center and the base at the periphery; it exaggerates the apical area relative to the base, so apparent defect size on the map does not match myocardial mass. Quantitative software compares each polar-map sample with a sex-, camera-, position-, and processing-specific normal database and shades samples that fall below the normal limit.
The review sequence begins with the raw rotating projections, where motion, extracardiac activity, breast and diaphragm shadows, and the injection site are visible and nowhere else. Tomographic slices, corrected and uncorrected, follow; then the gated cine, wall motion, and thickening; then the visual perfusion pattern; then the polar map and scores, which are accepted only when they agree with the images.
The 17-segment model and semiquantitative scoring
The AHA standardized model divides the left ventricle into 17 segments: six basal segments (anterior, anteroseptal, inferoseptal, inferior, inferolateral, anterolateral), six mid segments with the same names, four apical segments (anterior, septal, inferior, lateral), and the apex. Each segment is scored at stress and at rest on a five-point scale: 0 normal, 1 mildly reduced, 2 moderately reduced, 3 severely reduced, and 4 absent uptake.
- Summed stress score (SSS): the sum of the 17 stress scores, the extent and severity of all stress abnormality, ischemic and fixed.
- Summed rest score (SRS): the sum of the rest scores, reflecting scar or hibernation.
- Summed difference score (SDS = SSS − SRS): the reversible, ischemic component.
The maximum score is 68 (17 × 4). Dividing a summed score by 68 expresses it as a percentage of the left ventricle, so an SDS of 7 corresponds to about 10% ischemic myocardium. An SSS below 4 is normal or near normal, 4 to 8 mildly abnormal, 9 to 13 moderately abnormal, and 14 or more severely abnormal. These bands come from the Cedars-Sinai prognostic studies; software-derived total perfusion deficit, which integrates the area and depth of abnormality from the polar map, does not agree numerically with summed scores, and a report states which metric and which software produced it. A summed score cannot separate extent from severity: one segment scored 4 adds the same as four segments scored 1.
Territory assignment is an inference. In the usual right-dominant circulation, the left anterior descending artery (LAD) supplies segments 1, 2, 7, 8, 13, 14, and 17; the right coronary artery (RCA) supplies 3, 4, 9, 10, and 15; and the left circumflex artery (LCx) supplies 5, 6, 11, 12, and 16. The apex usually belongs to the LAD, and the inferior and inferolateral walls belong to the RCA or the LCx according to dominance, so a report names the involved segments first and the likely vessel second.
Summed stress, rest, and difference scores from 17 segment entries
| Segment | Usual territory | Stress score | Rest score |
|---|---|---|---|
| 1. Basal anterior | LAD | ||
| 2. Basal anteroseptal | LAD | ||
| 3. Basal inferoseptal | RCA | ||
| 4. Basal inferior | RCA | ||
| 5. Basal inferolateral | LCx | ||
| 6. Basal anterolateral | LCx | ||
| 7. Mid anterior | LAD | ||
| 8. Mid anteroseptal | LAD | ||
| 9. Mid inferoseptal | RCA | ||
| 10. Mid inferior | RCA | ||
| 11. Mid inferolateral | LCx | ||
| 12. Mid anterolateral | LCx | ||
| 13. Apical anterior | LAD | ||
| 14. Apical septal | LAD | ||
| 15. Apical inferior | RCA | ||
| 16. Apical lateral | LCx | ||
| 17. Apex | LAD |
Percent of left ventricle = summed score ÷ 68 × 100. Territory assignment follows the usual right-dominant pattern of the AHA 17-segment model. Risk bands from the Cedars-Sinai SPECT cohorts and the ACCF/AHA noninvasive risk table; the scores assume an adequate stress and a technically adequate study.
Myocardial flow reserve and rate-pressure product from PET rest and stress flow
Flow reserve = stress myocardial blood flow ÷ rest myocardial blood flow. Thresholds from the 2018 SNMMI/ASNC joint position paper, the 2016 ASNC/SNMMI PET guideline, and the Rb-82 PET prognostic cohort of Murthy and colleagues. The interpretation assumes technically valid dynamic data and adequate vasodilator stress.
Reversible, fixed, and mixed perfusion defects
| Pattern | Stress | Rest | Gated thickening | Interpretation |
|---|---|---|---|---|
| Reversible | Defect | Normal | Normal at rest; may be reduced after stress (stunning) | Inducible ischemia |
| Partially reversible (mixed) | Defect | Smaller or milder defect | Reduced in the scarred core | Scar with peri-infarct ischemia in the same territory |
| Fixed, with absent thickening | Defect | Same defect | Absent | Scar; dedicated viability imaging when recovery is the question |
| Fixed, with preserved thickening | Defect | Same defect | Preserved | Attenuation artifact or small subendocardial scar |
| Reverse redistribution | Normal or milder | Defect | Variable | Technical cause (attenuation change, processing) or reperfused infarct; raw data reviewed first |
Defect severity and systolic thickening are read together; a fixed defect does not measure scar transmurality.
Defects are described by extent (small, medium, large, or the number of segments), severity (mild, moderate, severe), reversibility (complete, partial, none), and location (by segment). The subendocardium is affected first, because it bears the highest wall stress and is perfused almost entirely in diastole; a mild defect can therefore exist with entirely normal contraction. With technetium agents, reversibility requires two injections; with thallium, a defect can fill in on delayed images from a single stress injection. A defect that persists after reinjection is stronger evidence of scar than a defect on redistribution images alone.
Gated function: ejection fraction, volumes, and wall motion
Ejection fraction (EF = [end-diastolic volume − end-systolic volume] ÷ end-diastolic volume) and volumes are derived from endocardial surfaces fitted to the count profile of each frame. Gated values are reproducible within a method but are not interchangeable with echocardiographic or magnetic resonance values, and serial comparison uses the same camera, software, and framing.
Three conditions bias the numbers. In a small left ventricle, counts from opposing walls blur across the end-systolic cavity, end-systolic volume is underestimated, and ejection fraction is overestimated; an ejection fraction of 85% or more in a small heart, common in women, is reviewed for this artifact. Atrial fibrillation, frequent ectopy, or bigeminy mix cycles of different length into the same frame and corrupt volumes and ejection fraction, while summed perfusion often remains interpretable; the beat histogram is reviewed before the ejection fraction is read. Large perfusion defects leave the algorithm no wall to fit, and contours across a severe defect are inspected on the cine.
Post-stress gated SPECT is acquired 15 to 45 minutes after stress and measures function after the ischemic episode. A post-stress ejection fraction lower than rest, or a new regional wall motion abnormality after stress, reflects stunning from severe ischemia. In 1,680 patients with gated SPECT, a post-stress ejection fraction below 45% was associated with cardiac mortality of 9.2% per year even with only mild or moderate perfusion abnormalities, and an end-systolic volume above 70 mL with 8.2% per year. An ejection fraction of 45% or more was associated with mortality below 1% per year despite severe perfusion abnormalities. On Rb-82 PET, ejection fraction normally rises at peak vasodilator stress (by a mean of about 5 to 7 percentage points in patients without ischemia). The mean change was negative in patients with left main or three-vessel disease, and a rise of more than 5 points had a negative predictive value of 97% for excluding them. Ejection fraction thresholds are specific to the tracer and protocol.
High-risk findings beyond the perfusion defect
The extent of the perfusion abnormality is the strongest imaging predictor of events, but several non-perfusion findings identify extensive disease even when relative perfusion understates it.
| Finding | Threshold or appearance | Mechanism and caveat |
|---|---|---|
| Large ischemic burden | ≥10% of LV ischemic (SDS ≥7); defects in more than one territory | Annual risk of death or MI above 3% |
| Transient ischemic dilation (TID) | Stress-to-rest LV cavity ratio above the laboratory limit (about 1.2 in validation cohorts) | Diffuse subendocardial ischemia or true stress dilation; tracer, protocol, and software specific; also seen with hypertrophy, small hearts, and diabetes |
| Post-stress LVEF fall or low post-stress LVEF | Post-stress LVEF <45%; ESV >70 mL; fall from rest | Stunning from extensive ischemia; requires reliable gating |
| Increased lung uptake | Lung-to-heart ratio >0.44 (Tc-99m sestamibi after exercise); thallium has its own, higher limit | Raised left ventricular filling pressure during stress; also smoking and lung disease |
| Transient right ventricular uptake | RV more visible at stress than at rest | Relative fall in LV counts from balanced LV ischemia |
| Reduced global PET flow reserve | MFR <1.5 | Diffuse or multivessel flow limitation, or microvascular dysfunction |
| Failure of LVEF to rise on PET | LVEF reserve negative; a rise of more than 5 points makes left main or three-vessel disease unlikely | Peak-stress dysfunction (Rb-82 data) |
| Stress ECG and hemodynamics | ST depression ≥2 mm at low workload, ST elevation, exercise hypotension, sustained VT, limiting angina at low workload | Independent of perfusion; reported even with a normal image |
| Resting LV dysfunction | Resting LVEF <35% | Strongest single predictor of mortality |
ESV, end-systolic volume; LV, left ventricle; LVEF, left ventricular ejection fraction; MFR, myocardial flow reserve; MI, myocardial infarction; SDS, summed difference score; VT, ventricular tachycardia. TID threshold from Abidov and colleagues (highest quartile ≥1.21, dual-isotope SPECT); lung-to-heart ratio from Bacher-Stier and colleagues; gated SPECT thresholds from Sharir and colleagues; PET ejection fraction reserve from Dorbala and colleagues.
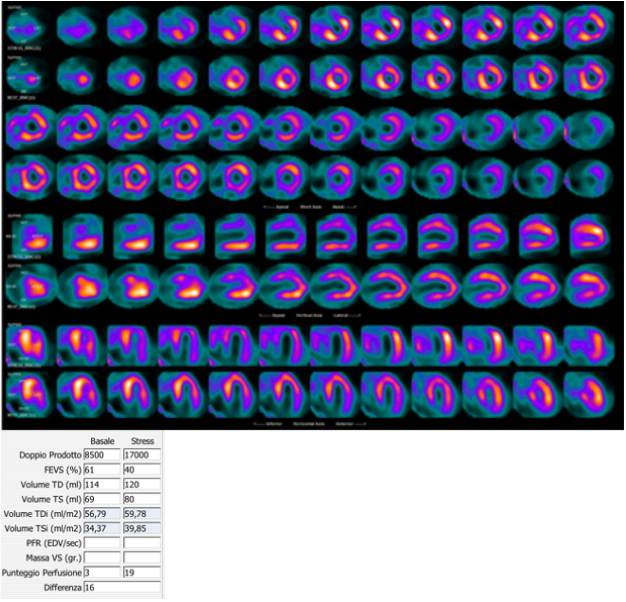
TID is the ratio of left ventricular cavity size on stress images to cavity size on rest images. In patients with otherwise normal SPECT, those in the highest TID quartile (1.21 or more) had more cardiac events than the rest, independent of age, typical angina, and diabetes. The normal limit differs between exercise and vasodilator stress, between single- and dual-isotope protocols, between cameras, and between software packages, and PET and flurpiridaz have their own limits; no single universal ratio applies. When several high-risk markers coexist, especially with ST depression or hypotension, the probability of left main or three-vessel disease is high whatever the relative perfusion shows.
Normal variants and right ventricular uptake
Apical thinning is a mild, symmetric reduction at the apex on stress and rest with preserved apical thickening, caused by the partial-volume effect on genuinely thin myocardium. The basal septum shows lower counts because its uppermost portion is membranous and fibrous. Papillary muscles appear as focal hot spots projecting into the cavity, and the normal right ventricular free wall is faint. Normal databases incorporate these patterns, so a variant is scored as a defect when the database does not match the patient's sex, camera, position, or reconstruction.
Visible right ventricular uptake at rest occurs with right ventricular hypertrophy, most often from pulmonary hypertension. Right ventricular uptake that increases at stress relative to the left ventricle usually reflects reduced left ventricular counts, which is a marker of balanced left ventricular ischemia, not of right ventricular disease. An enlarged left ventricular cavity on both stress and rest images indicates left ventricular dilation and is distinct from transient dilation.
Artifacts: attenuation, motion, conduction disease, and extracardiac activity
A count reduction indicates fewer detected photons, and coronary disease is only one cause. Seven mechanisms produce defects with normal coronary flow, and each has a source of evidence that resolves it.
| Artifact | Appearance | Resolving evidence |
|---|---|---|
| Breast attenuation | Anterior or anterolateral fixed defect, more frequent in women and with implants; can vary between stress and rest if breast position changes | Breast shadow on the projection cine; preserved thickening; attenuation correction; consistent breast positioning |
| Diaphragmatic attenuation | Inferior fixed defect, more frequent in men and with a large abdomen | Resolution on prone imaging or attenuation correction; preserved thickening |
| Patient motion and upward creep | Defects in opposite walls that do not follow a coronary territory; "hurricane sign" on short-axis slices | Step or drift on the projection cine; reacquisition or motion correction; a delay of 15 minutes after exercise reduces creep |
| Left bundle branch block or right ventricular pacing | Reversible septal or anteroseptal defect sparing the apex and anterior wall, accentuated by tachycardia | Vasodilator stress without exercise; septal dyssynchrony on gated images |
| Extracardiac activity (liver, gallbladder, bowel, stomach) | Inferior defect from scatter and normalization, or spurious inferior counts that mask a defect | Activity visible on raw projections; delayed or repeat imaging; low-level exercise with vasodilators |
| Attenuation map error on SPECT/CT or PET/CT | Defect present only after correction, commonly anterolateral or inferior | Fused CT and emission display showing misregistration; truncation; contrast in the map |
| Injection infiltration or low counts | Globally noisy study; focal activity at the injection site | Projection cine; repeat injection |
Artifacts in SPECT and PET perfusion imaging, after the 2018 ASNC SPECT guideline and the 2016 ASNC/SNMMI PET guideline.
A defect is attributed to disease only after these mechanisms are excluded. A misregistered attenuation map on SPECT or PET creates a defect that is absent on uncorrected images, so corrected and uncorrected images are read together. PET relies entirely on the map, and a lateral shift of a few millimeters at the lung-heart border produces an apparent lateral defect. A uniform image is not normal when stress conditions were inadequate: caffeine before a vasodilator, injection after exercise stopped, or termination at low workload leaves the heart near resting flow.
Balanced ischemia, left main disease, and coronary microvascular dysfunction
Relative perfusion images are scaled to the brightest region of the same heart. When left main or three-vessel disease limits hyperemic flow in every territory by a similar proportion, the reference region falls with the others, and the display can appear uniform. Most patients with severe multivessel disease still show a regional defect, usually in the territory of the most severe stenosis, so the defect underestimates the true burden more often than it disappears entirely. The clues are the stress electrocardiogram (ST depression, especially with vasodilators), exercise hypotension, transient ischemic dilation, a post-stress fall in ejection fraction, increased lung uptake, transient right ventricular visualization, and, on PET, a globally reduced stress flow and reserve.
Absolute flow measurement addresses the limitation directly. A homogeneous relative study with global stress flow and reserve above 2.0 makes high-risk anatomy unlikely, whereas homogeneous perfusion with a global reserve below 1.5 is not a normal study. Heavy coronary calcium on the attenuation CT adds to the suspicion. A symptomatic patient with a uniform relative study and high-risk ancillary findings is evaluated for left main and multivessel disease by coronary angiography or CT angiography.
Coronary microvascular dysfunction. A reduced global flow reserve with normal relative perfusion and no obstructive epicardial disease on CT or invasive angiography is the PET signature of coronary microvascular dysfunction. The 2021 AHA/ACC chest pain guideline rates stress PET with flow reserve as reasonable in patients with persistent stable chest pain and nonobstructive coronary disease (Class 2a). The COVADIS criteria use a coronary flow reserve below 2.0 to 2.5, depending on method, as evidence of impaired microvascular function. Microvascular dysfunction carries adverse prognosis independent of obstructive disease and is common in women, diabetes, hypertension, chronic kidney disease, and hypertrophic cardiomyopathy. Endotypes, invasive coronary function testing, and treatment are covered under ischemia with nonobstructive coronary arteries.
Hybrid SPECT/CT and PET/CT with coronary calcium
Hybrid scanners acquire a low-dose CT for attenuation correction with every study. Coronary calcium visible on that CT indicates atherosclerosis even when perfusion is normal, and its absence lowers risk further. The 2016 Society of Cardiovascular Computed Tomography (SCCT) and Society of Thoracic Radiology guideline recommends that coronary calcium be reported on all noncontrast chest CT, using a visual ordinal estimate (none, mild, moderate, severe) when the scan is not gated. The 2022 hybrid CT guideline from ASNC, SCCT, SNMMI, and the American Association of Physicists in Medicine recommends that calcium visible on the attenuation CT be described. An Agatston score requires a dedicated ECG-gated acquisition with standard slice thickness. Normal perfusion with extensive calcium identifies patients who benefit from intensified preventive therapy; it also raises concern for balanced ischemia when the clinical picture and ancillary findings are high risk. Hybrid imaging can also combine perfusion with coronary CT angiography, fusing a defect with the stenosis that explains it. The low-dose CT field also shows extracardiac findings (lung nodules, masses, pleural and pericardial effusion, aortic dilation, hiatal hernia), which are reported under laboratory policy.
Diagnostic accuracy and comparison with other stress tests
| Test | Sensitivity | Specificity | Source |
|---|---|---|---|
| SPECT, angiographic stenosis ≥50% | 88% | 61% | Meta-analysis of 114 studies (Jaarsma 2012) |
| PET, angiographic stenosis ≥50% | 84% | 81% | Meta-analysis of 15 studies (Jaarsma 2012) |
| Stress CMR, angiographic stenosis ≥50% | 89% | 76% | Meta-analysis of 37 studies (Jaarsma 2012) |
| SPECT, FFR ≤0.80 | 57% | 94% | PACIFIC, 208 patients |
| O-15 water PET, FFR ≤0.80 | 87% | 84% | PACIFIC |
| CCTA, FFR ≤0.80 | 90% | 60% | PACIFIC |
| Flurpiridaz PET, stenosis ≥50% (3 readers) | 74% to 89% | 53% to 70% | Phase 3 study 1, 578 patients; SPECT sensitivity 61% to 76% |
CCTA, coronary CT angiography; CMR, cardiovascular magnetic resonance; FFR, fractional flow reserve. In PACIFIC, overall accuracy was 85% for PET, 77% for SPECT, and 74% for CCTA. Referral bias toward patients with abnormal tests lowers apparent specificity in angiographic series.
PET outperforms SPECT chiefly in specificity and in obese patients, because of routine attenuation correction, higher count density, and peak-stress gating, and in multivessel disease because of flow quantification. Stress echocardiography has similar accuracy to SPECT without radiation but depends on acoustic windows and reader experience, and it is less useful with left bundle branch block, prior extensive infarction, or poor windows. Stress CMR has accuracy similar to PET without radiation and adds scar imaging, but requires longer scan times and is limited by some devices, claustrophobia, and severe kidney disease when gadolinium is used. CCTA has the highest sensitivity and negative predictive value and shows nonobstructive plaque, but it is limited by calcium, heart rate, and iodinated contrast, and it does not show ischemia without FFR-CT or CT perfusion. Test choice by pretest probability and clinical question is set out under chronic coronary disease.
Prognosis after a normal or abnormal perfusion study
A normal perfusion study after adequate stress predicts an annual rate of cardiac death or myocardial infarction below 1%; in 5,183 patients, both cardiac death and myocardial infarction occurred at 0.5% per year or less after a normal SPECT, and rates rose with each increment of scan abnormality. The low-risk period is shorter, and residual risk higher, in older patients and in patients with diabetes, known coronary disease, chronic kidney disease, poor exercise capacity, extensive coronary calcium, a reduced flow reserve, TID, or pharmacologic stress, which selects sicker patients. A normal stress perfusion study does not exclude atherosclerosis, and patients with risk factors continue preventive therapy.
The 2023 AHA/ACC chronic coronary disease guideline retains the ACCF/AHA annual risk categories: resting or stress perfusion abnormality of 10% or more of the myocardium (or in multiple territories), stress-induced left ventricular dilation, severe stress-induced dysfunction, and resting ejection fraction below 35% indicate annual risk of death or myocardial infarction above 3%; perfusion abnormality of 5% to 9.9% indicates 1% to 3%; and normal perfusion or a defect below 5% indicates less than 1%. The full risk table is on the chronic coronary disease page.
Ischemic burden and revascularization. In a registry of 10,627 patients without prior infarction or revascularization, revascularization was associated with better survival than medical therapy when ischemia was moderate to severe (more than about 10% of the myocardium), and medical therapy was associated with better survival when ischemia was absent or mild. In the COURAGE nuclear substudy, percutaneous coronary intervention (PCI) added to optimal medical therapy reduced ischemic myocardium more than medical therapy alone (−2.7% versus −0.5%). The randomized ISCHEMIA trial tested the registry hypothesis in 5,179 patients with moderate or severe ischemia (most by stress imaging, about 10% or more of the myocardium on nuclear studies). It excluded left main stenosis of 50% or more and ejection fraction below 35%. Over a median 3.2 years, an initial invasive strategy did not reduce the composite of cardiovascular death, myocardial infarction, resuscitated cardiac arrest, or hospitalization for unstable angina or heart failure. It improved angina and quality of life in patients with frequent angina. Ischemic burden therefore predicts risk and informs, but does not by itself determine, the decision to revascularize; anatomy (left main disease, reduced ejection fraction), symptoms on guideline-directed therapy, and patient preference determine it.
Myocardial viability with FDG PET
Dysfunctional myocardium falls into four states: stunned (perfusion restored, function recovering spontaneously over hours to days), hibernating (chronically reduced flow or flow reserve with preserved metabolism, recoverable after revascularization), scar, and mixtures of these. FDG PET combined with a resting perfusion study separates them. A perfusion-metabolism mismatch, reduced perfusion with preserved or increased FDG uptake, indicates hibernating myocardium; a match, reduced perfusion with reduced FDG uptake, indicates scar; and normal perfusion with reduced FDG uptake (reverse mismatch) occurs in left bundle branch block, some cardiomyopathies, and inadequate preparation.
Viability imaging requires glucose loading: an oral glucose load with insulin titrated to the measured blood glucose, or a hyperinsulinemic euglycemic clamp, drives FDG into viable myocytes. Insulin resistance and uncontrolled diabetes suppress myocardial uptake and create a false scar pattern, and a study with failed preparation is reported as nondiagnostic. FDG imaging of inflammation, as in cardiac sarcoidosis, uses the opposite preparation: a high-fat, very-low-carbohydrate diet and prolonged fast to suppress normal myocardial glucose use. Thallium redistribution and reinjection, nitrate-enhanced technetium imaging, dobutamine echocardiography, and late gadolinium enhancement on CMR are the alternatives.
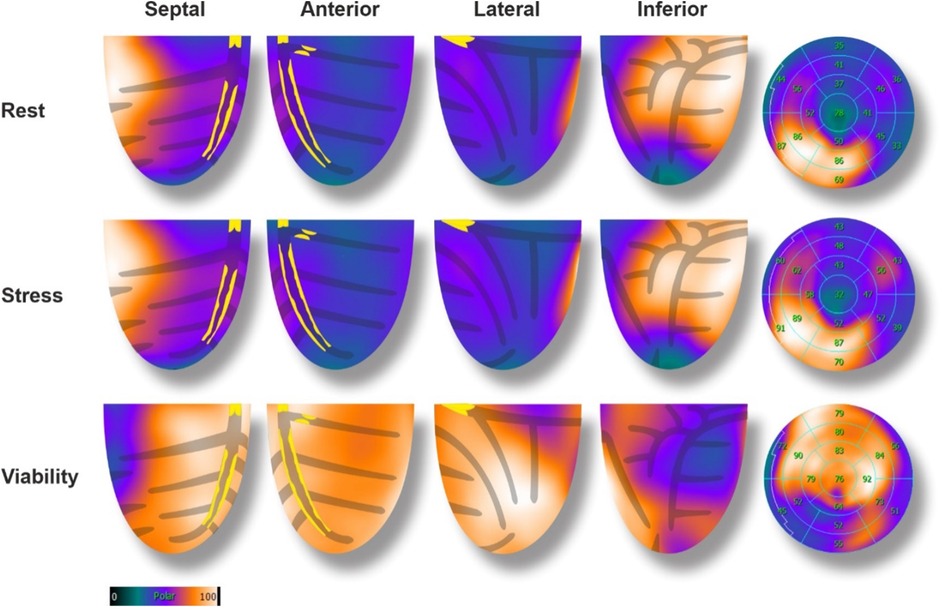
Viability predicts the probability of regional and global functional recovery, but randomized evidence has not shown that it selects patients for revascularization. In PARR-2 (430 patients with severe left ventricular dysfunction), FDG-guided management did not significantly reduce the composite of cardiac death, myocardial infarction, or cardiac hospitalization at 1 year (30% versus 36%), although adherence to the imaging recommendation was associated with benefit. In the 10-year STICH viability analysis, viability did not identify patients who gained survival from bypass surgery (interaction P = 0.34), and in REVIVED-BCIS2, PCI in patients with viable myocardium did not reduce death or heart failure hospitalization. Viability studies are used to quantify the amount and distribution of scar and recoverable myocardium when that information will change a revascularization decision; trial details are on the chronic coronary disease page.
Perfusion imaging after revascularization and serial studies
After PCI or bypass surgery, perfusion imaging is used for recurrent or new symptoms, to localize ischemia when the culprit among several grafts or stents is uncertain, and to judge the extent of residual ischemia. Routine periodic anatomic or ischemic testing in patients with chronic coronary disease and no change in clinical or functional status is not recommended for risk stratification or to guide therapy in the 2023 chronic coronary disease guideline (Class 3: No Benefit). Bypass graft patients frequently have reduced global flow reserve from diffuse native disease even with patent grafts, so flow values in this group are interpreted with the anatomy. Serial perfusion studies are compared only when acquisition, camera, reconstruction, software, and normal database are matched; otherwise the change is described in words and its limitation stated. In the COURAGE nuclear substudy, patients with a reduction in ischemia of 5% or more had a lower unadjusted risk of death or myocardial infarction.
Special populations: women, obesity, conduction disease, kidney disease, pregnancy, and breastfeeding
Women. Breast attenuation, smaller hearts, and a higher prevalence of microvascular dysfunction reduce the specificity and sensitivity of SPECT in women. Attenuation correction, consistent breast positioning, sex-specific databases, PET, and flow quantification address these limits. A small left ventricle overestimates ejection fraction and can mask TID.
Obesity. Soft-tissue attenuation, scatter, and greater detector distance lower count density and spatial resolution. A two-day protocol with full activity on each day, longer acquisitions, attenuation correction, and prone imaging help on SPECT; PET is preferred in severe obesity because 511-keV photons are attenuated less, attenuation correction is integral, and image quality is maintained. Table weight limits and the bore diameter are confirmed before scheduling.
Left bundle branch block and ventricular pacing. A septal defect after vasodilator stress that involves the apex or anterior wall supports LAD disease.
Chronic kidney disease and dialysis. Regadenoson requires no renal dose adjustment and is safe in kidney failure. Diffuse atherosclerosis, vascular calcification, and microvascular dysfunction make reduced flow reserve common and less specific for focal obstruction. Perfusion imaging is frequently used before kidney transplantation.
Pregnancy. The first decision is whether the clinical question can be answered without ionizing radiation; a necessary study is not withheld solely because of pregnancy. Exercise is preferred when imaging is unavoidable, with reduced administered activity, hydration, and frequent voiding.
Breastfeeding. Interruption intervals depend on the tracer. Rb-82 and O-15 water require none, and N-13 ammonia requires 1 hour. The flurpiridaz label specifies pumping and discarding milk for at least 8 hours, and the 2026 ASNC guideline and the flurpiridaz procedure standard recommend at least 12 hours. The 2026 ASNC guideline recommends 24 hours for technetium agents (other bodies accept 4 hours) and 96 hours for thallium-201. A lactating patient receives written tracer-specific instructions.
Younger patients. Radiation risk is greater over a longer lifetime, so PET, stress-only protocols, and nonradiation tests are favored, and repeated low-yield studies are avoided.
Automated quantification, artificial intelligence, and structured reporting
Automated quantification (total perfusion deficit, ejection fraction, volumes, TID, phase analysis) improves reproducibility over visual reading alone. Deep-learning models applied to polar maps and to combined perfusion, gated, and clinical data estimate the probability of obstructive disease and of events. In a multicenter study, an explainable deep-learning model for SPECT had a higher area under the curve for obstructive disease than total perfusion deficit and than expert readers. Artificial intelligence also derives coronary calcium from low-dose attenuation CT and reduces noise in low-dose or fast acquisitions. These tools inherit every acquisition error, perform less well in populations unlike their training data, and require local validation; they support the reader's integrated interpretation and do not replace it.
Structured reporting. A perfusion report states the indication, the protocol and tracer with administered activity, and the stress: method, agent and dose, achieved workload and heart rate or vasodilator conditions, symptoms, ECG and blood pressure response, and reason for termination. Image quality (count density, motion, attenuation, extracardiac activity, gating) follows. Perfusion findings are described by location in segments, extent, severity, and reversibility, with summed scores or total perfusion deficit and the percentage of the left ventricle involved. Function includes rest and post-stress ejection fraction, volumes, and regional motion. Ancillary findings (TID, lung and right ventricular uptake, coronary calcium, extracardiac findings) are reported individually. PET reports add global and regional rest flow, stress flow, and reserve with the tracer, software, and technical validity.
The impression places ischemia or scar and its extent first, then ventricular function, high-risk ancillary findings, and comparison with prior studies, and it states a risk category. A normal study is reported as no inducible flow limitation under the stated stress, not as absence of coronary disease. Perfusion imaging does not measure luminal narrowing, so a report does not assign a percentage stenosis. An equivocal finding names its source and the data that would resolve it, and a nondiagnostic study (failed vasodilation, inadequate exercise, invalid flow data) is labeled as such. Critical findings, such as severe extensive ischemia with hemodynamic or ECG instability, are communicated directly to the referring clinician and documented.
Self-assessment
A 68-year-old man with exertional dyspnea and diabetes has regadenoson Tc-99m SPECT. Relative perfusion is homogeneous (SSS 2). During the injection he develops 2 mm of horizontal ST depression in V4 to V6; the stress-to-rest cavity ratio is 1.32, post-stress LVEF is 41% against 56% at rest, and the attenuation CT shows heavy three-vessel calcification. How is the study classified, and what is the next step?
Nuclear Cardiology Board ReviewReferences
- Duvall WL, Skali H, Aggarwal NR, et al. 2026 American Society of Nuclear Cardiology guideline for stress testing in single-photon emission computed tomography and positron emission tomography myocardial perfusion imaging. J Nucl Cardiol. 2026:102970. doi:10.1016/j.nuclcard.2026.102970
- Henzlova MJ, Duvall WL, Einstein AJ, Travin MI, Verberne HJ. ASNC imaging guidelines for SPECT nuclear cardiology procedures: stress, protocols, and tracers. J Nucl Cardiol. 2016;23:606–639. doi:10.1007/s12350-015-0387-x
- Dorbala S, Ananthasubramaniam K, Armstrong IS, et al. Single photon emission computed tomography (SPECT) myocardial perfusion imaging guidelines: instrumentation, acquisition, processing, and interpretation. J Nucl Cardiol. 2018;25:1784–1846. doi:10.1007/s12350-018-1283-y
- Dilsizian V, Bacharach SL, Beanlands RS, et al. ASNC imaging guidelines/SNMMI procedure standard for positron emission tomography (PET) nuclear cardiology procedures. J Nucl Cardiol. 2016;23:1187–1226. doi:10.1007/s12350-016-0522-3
- Bateman TM, Al-Mallah MH, Alnabelsi TS, et al. Clinical indications for positron emission tomography myocardial perfusion imaging and myocardial blood flow quantification: an American Society of Nuclear Cardiology position statement. J Nucl Cardiol. 2026;57:102619. doi:10.1016/j.nuclcard.2025.102619
- Bateman TM, Dilsizian V, Beanlands RS, et al. American Society of Nuclear Cardiology and Society of Nuclear Medicine and Molecular Imaging joint position statement on the clinical indications for myocardial perfusion PET. J Nucl Cardiol. 2016;23:1227–1231. doi:10.1007/s12350-016-0626-9
- Murthy VL, Bateman TM, Beanlands RS, et al. Clinical quantification of myocardial blood flow using PET: joint position paper of the SNMMI Cardiovascular Council and the ASNC. J Nucl Med. 2018;59:273–293. doi:10.2967/jnumed.117.201368
- Bateman TM, Heller GV, Beanlands R, et al. Practical guide for interpreting and reporting cardiac PET measurements of myocardial blood flow: an information statement from the American Society of Nuclear Cardiology, and the Society of Nuclear Medicine and Molecular Imaging. J Nucl Cardiol. 2021;28:768–787. doi:10.1007/s12350-021-02552-7
- Packard RRS, Maddahi J, Pelletier-Galarneau M, et al. SNMMI/EANM/ASNC/ACNM procedure standard/practice guideline for 18F-flurpiridaz PET myocardial perfusion imaging and blood flow quantitation. J Nucl Med. 2025;66:1538–1554. doi:10.2967/jnumed.125.270873
- FLYRCADO (flurpiridaz F 18) injection. US prescribing information. GE HealthCare; initial US approval 2024.
- LEXISCAN (regadenoson) injection. US prescribing information. Astellas Pharma US.
- Gulati M, Levy PD, Mukherjee D, et al. 2021 AHA/ACC/ASE/CHEST/SAEM/SCCT/SCMR guideline for the evaluation and diagnosis of chest pain: a report of the American College of Cardiology/American Heart Association Joint Committee on Clinical Practice Guidelines. Circulation. 2021;144:e368–e454. doi:10.1161/CIR.0000000000001029
- Virani SS, Newby LK, Arnold SV, et al. 2023 AHA/ACC/ACCP/ASPC/NLA/PCNA guideline for the management of patients with chronic coronary disease: a report of the American Heart Association/American College of Cardiology Joint Committee on Clinical Practice Guidelines. Circulation. 2023;148:e9–e119. doi:10.1161/CIR.0000000000001168
- Cerqueira MD, Allman KC, Ficaro EP, et al. Recommendations for reducing radiation exposure in myocardial perfusion imaging. J Nucl Cardiol. 2010;17:709–718. doi:10.1007/s12350-010-9244-0
- Einstein AJ, Pascual TN, Mercuri M, et al. Current worldwide nuclear cardiology practices and radiation exposure: results from the 65 country IAEA Nuclear Cardiology Protocols Cross-Sectional Study (INCAPS). Eur Heart J. 2015;36:1689–1696. doi:10.1093/eurheartj/ehv117
- Dorbala S, Di Carli MF, Delbeke D, et al. SNMMI/ASNC/SCCT guideline for cardiac SPECT/CT and PET/CT 1.0. J Nucl Med. 2013;54:1485–1507. doi:10.2967/jnumed.112.105155
- Al-Mallah MH, Bateman TM, Branch KR, et al. 2022 ASNC/AAPM/SCCT/SNMMI guideline for the use of CT in hybrid nuclear/CT cardiac imaging. J Nucl Cardiol. 2022;29:3491–3535. doi:10.1007/s12350-022-03089-z
- Hecht HS, Cronin P, Blaha MJ, et al. 2016 SCCT/STR guidelines for coronary artery calcium scoring of noncontrast noncardiac chest CT scans. J Cardiovasc Comput Tomogr. 2017;11:74–84. doi:10.1016/j.jcct.2016.11.003
- Cerqueira MD, Weissman NJ, Dilsizian V, et al. Standardized myocardial segmentation and nomenclature for tomographic imaging of the heart: a statement for healthcare professionals from the Cardiac Imaging Committee of the Council on Clinical Cardiology of the American Heart Association. Circulation. 2002;105:539–542. doi:10.1161/hc0402.102975
- Fletcher GF, Ades PA, Kligfield P, et al. Exercise standards for testing and training: a scientific statement from the American Heart Association. Circulation. 2013;128:873–934. doi:10.1161/CIR.0b013e31829b5b44
- Iskandrian AE, Bateman TM, Belardinelli L, et al. Adenosine versus regadenoson comparative evaluation in myocardial perfusion imaging: results of the ADVANCE phase 3 multicenter international trial. J Nucl Cardiol. 2007;14:645–658. doi:10.1016/j.nuclcard.2007.06.114
- Thomas GS, Thompson RC, Miyamoto MI, et al. The RegEx trial: a randomized, double-blind, placebo- and active-controlled pilot study combining regadenoson, a selective A2A adenosine agonist, with low-level exercise, in patients undergoing myocardial perfusion imaging. J Nucl Cardiol. 2009;16:63–72. doi:10.1007/s12350-008-9001-9
- Chang SM, Nabi F, Xu J, Raza U, Mahmarian JJ. Normal stress-only versus standard stress/rest myocardial perfusion imaging: similar patient mortality with reduced radiation exposure. J Am Coll Cardiol. 2010;55:221–230. doi:10.1016/j.jacc.2009.09.022
- Agostini D, Roule V, Nganoa C, et al. First validation of myocardial flow reserve assessed by dynamic 99mTc-sestamibi CZT-SPECT camera: head to head comparison with 15O-water PET and fractional flow reserve in patients with suspected coronary artery disease. The WATERDAY study. Eur J Nucl Med Mol Imaging. 2018;45:1079–1090. doi:10.1007/s00259-018-3958-7
- Murthy VL, Naya M, Foster CR, et al. Improved cardiac risk assessment with noninvasive measures of coronary flow reserve. Circulation. 2011;124:2215–2224. doi:10.1161/CIRCULATIONAHA.111.050427
- Patel KK, Spertus JA, Chan PS, et al. Myocardial blood flow reserve assessed by positron emission tomography myocardial perfusion imaging identifies patients with a survival benefit from early revascularization. Eur Heart J. 2020;41:759–768. doi:10.1093/eurheartj/ehz389
- Dorbala S, Vangala D, Sampson U, et al. Value of vasodilator left ventricular ejection fraction reserve in evaluating the magnitude of myocardium at risk and the extent of angiographic coronary artery disease: a 82Rb PET/CT study. J Nucl Med. 2007;48:349–358.
- Hachamovitch R, Berman DS, Shaw LJ, et al. Incremental prognostic value of myocardial perfusion single photon emission computed tomography for the prediction of cardiac death: differential stratification for risk of cardiac death and myocardial infarction. Circulation. 1998;97:535–543. doi:10.1161/01.cir.97.6.535
- Hachamovitch R, Hayes SW, Friedman JD, Cohen I, Berman DS. Comparison of the short-term survival benefit associated with revascularization compared with medical therapy in patients with no prior coronary artery disease undergoing stress myocardial perfusion single photon emission computed tomography. Circulation. 2003;107:2900–2907. doi:10.1161/01.CIR.0000072790.23090.41
- Sharir T, Germano G, Kavanagh PB, et al. Incremental prognostic value of post-stress left ventricular ejection fraction and volume by gated myocardial perfusion single photon emission computed tomography. Circulation. 1999;100:1035–1042. doi:10.1161/01.cir.100.10.1035
- Abidov A, Bax JJ, Hayes SW, et al. Transient ischemic dilation ratio of the left ventricle is a significant predictor of future cardiac events in patients with otherwise normal myocardial perfusion SPECT. J Am Coll Cardiol. 2003;42:1818–1825. doi:10.1016/j.jacc.2003.07.010
- Bacher-Stier C, Sharir T, Kavanagh PB, et al. Postexercise lung uptake of 99mTc-sestamibi determined by a new automatic technique: validation and application in detection of severe and extensive coronary artery disease and reduced left ventricular function. J Nucl Med. 2000;41:1190–1197.
- Jaarsma C, Leiner T, Bekkers SC, et al. Diagnostic performance of noninvasive myocardial perfusion imaging using single-photon emission computed tomography, cardiac magnetic resonance, and positron emission tomography imaging for the detection of obstructive coronary artery disease: a meta-analysis. J Am Coll Cardiol. 2012;59:1719–1728. doi:10.1016/j.jacc.2011.12.040
- Danad I, Raijmakers PG, Driessen RS, et al. Comparison of coronary CT angiography, SPECT, PET, and hybrid imaging for diagnosis of ischemic heart disease determined by fractional flow reserve. JAMA Cardiol. 2017;2:1100–1107. doi:10.1001/jamacardio.2017.2471
- Shaw LJ, Berman DS, Maron DJ, et al. Optimal medical therapy with or without percutaneous coronary intervention to reduce ischemic burden: results from the Clinical Outcomes Utilizing Revascularization and Aggressive Drug Evaluation (COURAGE) trial nuclear substudy. Circulation. 2008;117:1283–1291. doi:10.1161/CIRCULATIONAHA.107.743963
- Maron DJ, Hochman JS, Reynolds HR, et al. Initial invasive or conservative strategy for stable coronary disease. N Engl J Med. 2020;382:1395–1407. doi:10.1056/NEJMoa1915922
- Beanlands RS, Nichol G, Huszti E, et al. F-18-fluorodeoxyglucose positron emission tomography imaging-assisted management of patients with severe left ventricular dysfunction and suspected coronary disease: a randomized, controlled trial (PARR-2). J Am Coll Cardiol. 2007;50:2002–2012. doi:10.1016/j.jacc.2007.09.006
- Panza JA, Ellis AM, Al-Khalidi HR, et al. Myocardial viability and long-term outcomes in ischemic cardiomyopathy. N Engl J Med. 2019;381:739–748. doi:10.1056/NEJMoa1807365
- Perera D, Clayton T, O'Kane PD, et al. Percutaneous revascularization for ischemic left ventricular dysfunction. N Engl J Med. 2022;387:1351–1360. doi:10.1056/NEJMoa2206606
- Otaki Y, Singh A, Kavanagh P, et al. Clinical deployment of explainable artificial intelligence of SPECT for diagnosis of coronary artery disease. JACC Cardiovasc Imaging. 2022;15:1091–1102. doi:10.1016/j.jcmg.2021.04.030
- Bonow RO, Maurer G, Lee KL, et al. Myocardial viability and survival in ischemic left ventricular dysfunction. N Engl J Med. 2011;364:1617–1625. doi:10.1056/NEJMoa1100358
- Danad I, Uusitalo V, Kero T, et al. Quantitative assessment of myocardial perfusion in the detection of significant coronary artery disease: cutoff values and diagnostic accuracy of quantitative [15O]H2O PET imaging. J Am Coll Cardiol. 2014;64:1464–1475. doi:10.1016/j.jacc.2014.05.069